What is the percentile for babies
Weight For Age WHO 0-2 Year
English | 中文版
Weight Age 0-2 Length Age 0-2 Weight Length 0-2 Head Circum 0-2
Was this useful to you? Help others and share.
Description:
Note, the CDC recommends the use of the WHO charts for babies and infants from birth to two years of age. This app uses WHO tables and data for calculations.
This calculator provides your baby's weight percentile based on age. The percentile shows how your infant's weight compares to other infants. The percentile tells you what percentage of babies weigh less than your baby. For example out of a sample of 100 babies, a percentile value of 40 percent means your baby weighs more than 40 babies and weighs less than the other 60 babies.
A percentile of 50% represents the average or mean weight. A value below 50 percent means a baby weighs less than the average. A value greater than 50 percent means a baby is above average. This does not mean your baby is overweight or underweight. A doctor or physician should be consulted to determine weight status.
Calculation Instructions:
- Note, this calculator uses the World Health Organization (WHO) infant charts for 0-2 year olds
- Enter Birthday
- Enter Measurement Date
- Enter Weight
Outputs:
- Percentile - The weight percentile of the child.
- Age - The age of the child in months
- Weight - The mass of the child in metric and standard units.
- Graph Plot - Weight versus age graph with 5, 10, 25, 50, 75, 95 and calculated percentile lines.
Reference:
"The WHO Child Growth Standards". The World Health Organization. https://www.who.int/toolkits/child-growth-standards/standards.
Child Height Predictor:
Child Height Predictor - Predict Adult Height
CDC Recommended Growth Charts:
The United States Center for Disease Control (CDC) recommends using the World Health Organization (WHO) charts for the first two year of life (0 to 2 years).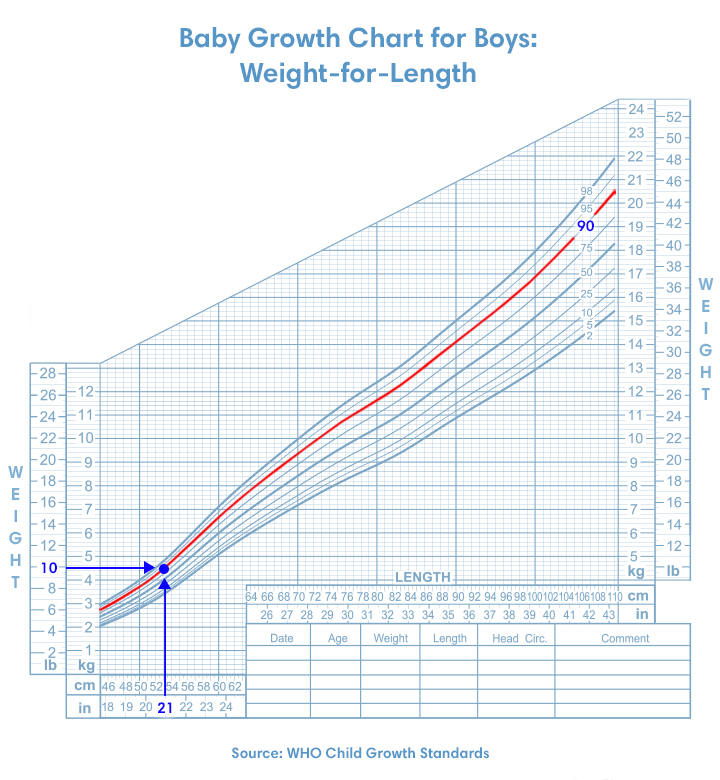 After two years, it is recommended to return to the CDC charts.
Weight-Age (WHO 0-2 years) Length-Age (WHO 0-2 years) Weight-Length (WHO 0-2 years) Head Circumference-Age (WHO 0-2 years)
Weight-Age (CDC 2-20 Years) Stature-Age (CDC 2-20 Years) Weight-Stature (CDC 2-20 Years)
CDC Growth Charts:
Weight-Age (CDC 0-3 years) Length-Age (CDC 0-3 years) Weight-Length (CDC 0-3 years) Head Circumference-Age (CDC 0-3 years) Weight-Age (CDC 2-20 Years) Stature-Age (CDC 2-20 Years) Weight-Stature (CDC 2-20 Years)
WHO Growth Charts:
Weight-Age (WHO 0-5 years) Length-Age (WHO 0-2 years) Height-Age (WHO 2-5 years) Weight-Length (WHO 0-2 years) Weight-Height (WHO 2-5 years) Head Circumference-Age (WHO 0-5 years)
Chinese Growth Charts:
Weight-Age (China 0-18 years) Length-Age (China 0-3 years) Height-Age (China 3-18 years) Head Circumference-Age (China 0-6 years) Weight-Length (China 0-3 years) Weight-Height (China 3-18 years)
Preterm Infant Growth Charts:
Weight-Age (23-41 Gestational Weeks) Length-Age (23-41 Gestational Weeks) Head Circumference-Age (23-41 Gestational)
Email Contact and Privacy Policy:
Contact: aj@ajdesigner.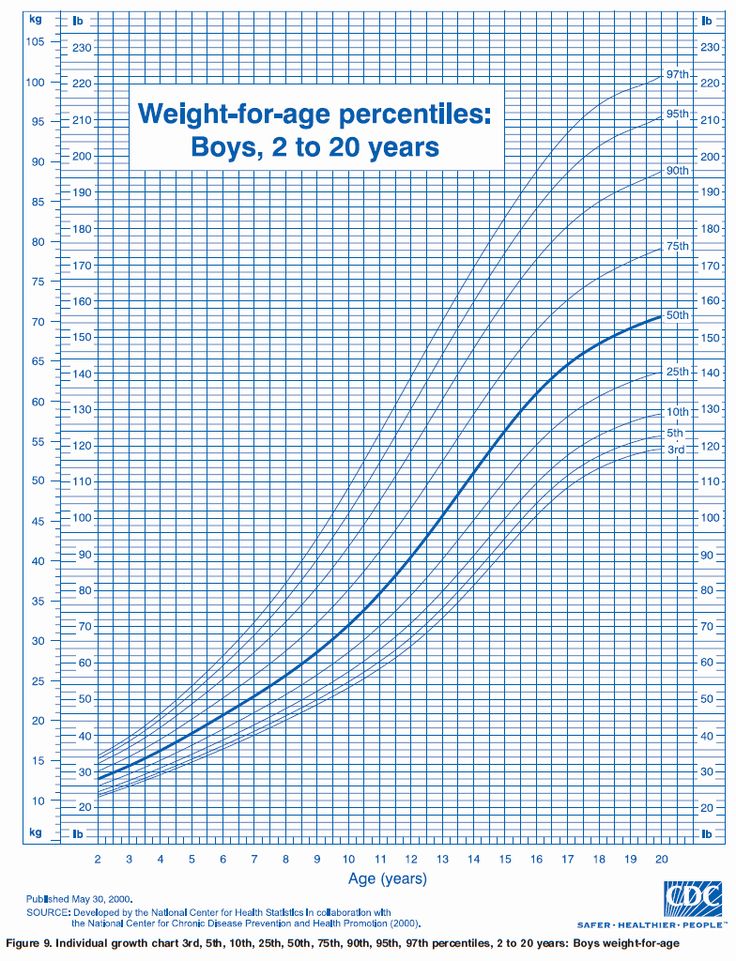 com
Privacy Policy - Legal Disclaimer
Popular Pages:
Sale Discount Calculator - Percent Off Loan Calculator Mortgage Extra Payment Paycheck Overtime Rate Calculator Jobs Salary Pay Check Converter Temperature Converter Fraction Calculator - Simplify Reduce Engine Motor Horsepower Calculator Earned Value Project Management Present Worth Calculator - Finance Constant Acceleration Motion Physics Statistics Equations Formulas Mortgage Loan Calculator - Finance Weight Loss Diet Calculator Body Mass Index BMI Calculator Light Bulb Energy Cost Analysis Automobile Fuel Economy - Gasoline Tire Size Comparison Calculator Water Pump Calculator - Hydraulics Geometry Square Circle Cylinder Triangle Calculator Torque Calculator Density Calculator Pressure Calculator Power Calculator Force Calculator
Disclaimer:
Use this calculator at your own risk. This calculator may or may not be accurate or reliable. By using this calculator you acknowledge any reliance on this calculator shall be at your sole risk.
AJ Design Software:
Technical Tools, Specifications, How to Guides, Training, Applications, Examples, Tutorials, Reviews, Answers, Test Review Resources, Analysis, Homework Solutions, Help, Data and Information for Engineers, Technicians, Teachers, Tutors, Researchers, K-12 Education, College and High School Students, Science Fair Projects and Scientists
Percentiles and What They Mean
Written by Steven Jerome Parker, MD
Q: My baby is small but my pediatric provider says she is "following the curve" so he is not worried. What does that mean? I'm still worried!
A. If your baby is "following the curve" of the growth chart, she's paralleling one of the percentile lines on the chart, and the odds are good that her caloric intake is fine, no matter how much or how little milk she seems to be drinking.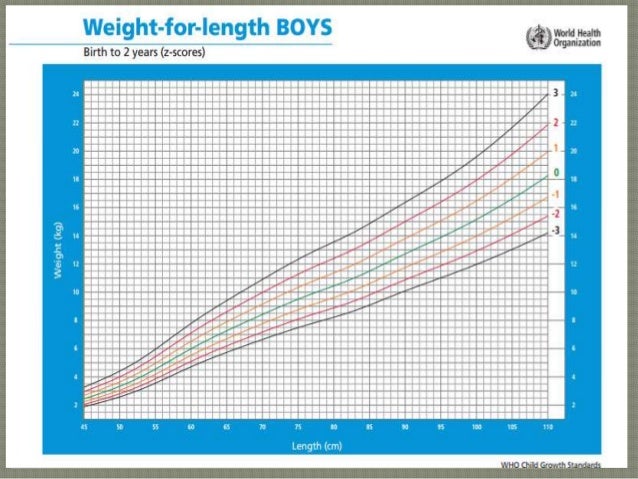
On the other hand, if she is "falling off the curve," she's dipping below two or more percentile lines on the growth chart, and she may have inadequate nutritional intake. This could represent a real problem.
Growth Charts: How They Work
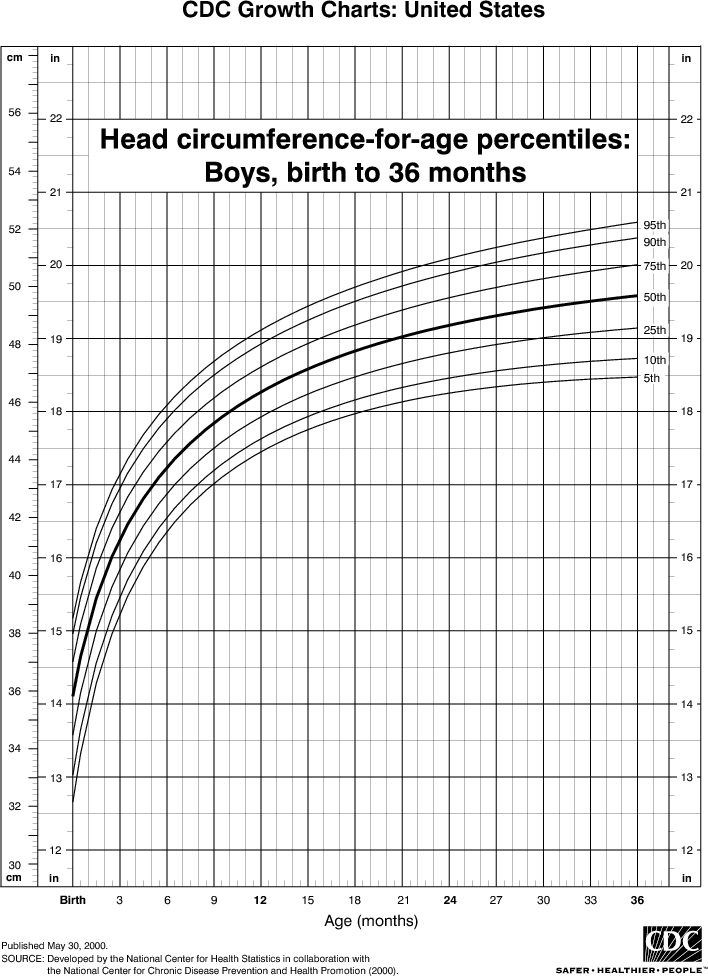
There are separate growth charts for weight, height, and head circumference.
These simply represent the average weight, height, or head circumference of a bunch of normal children. You will see the percentile lines on the chart running parallel to each other. The percentile lines include 5%, 10%, 25%, 50%, 75%, 90%, and 95%. (For more information, see the CDC's web site: www.cdc.gov/growthcharts/).
If a child's weight is at the 50th percentile line, that means that out of 100 normal children her age, 50 will be bigger than she is and 50 smaller. Similarly, if she is in the 75th percentile, that means that she is bigger than 75 children and smaller than only 25, compared with 100 children her age.
What Growth Charts Tell Us
The growth percentiles by themselves don't say much.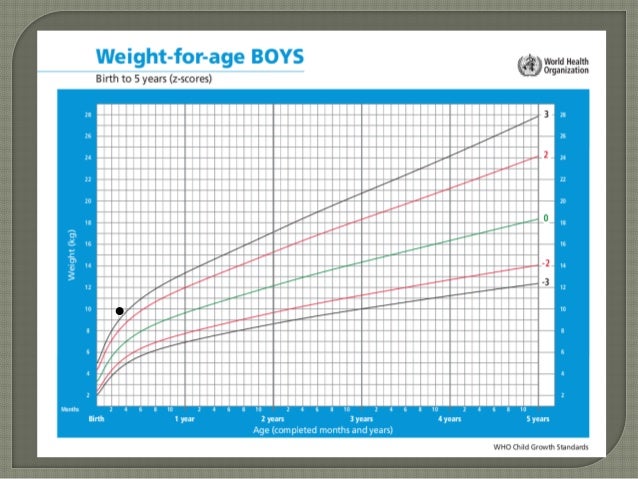 What really matters is the rate of growth:
- A normal rate of growth means the child's growth points closely follow a percentile line on the chart.
- We usually don't worry about insufficient (or excessive) growth until a child's growth rate has crossed at least two percentile lines (e.g., from above the 90th percentile to below the 50th).
- If a child's weight, height, or head size is below the 5th percentile, it's important to see if her growth points have always paralleled the 5th percentile line -- which would mean her growth rate is normal -- or if she is suddenly falling further behind, which is more concerning.
To see if your child is too skinny or overweight, there is a "weight for height" chart or a "BMI" index. These tell if your child's weight is close to what it should be, given her height.
How to Tell If Growth Could Be a Problem
One of the first signs that a child is not getting enough calories is when her weight increases at a much slower rate than her height and begins to fall below two percentile lines.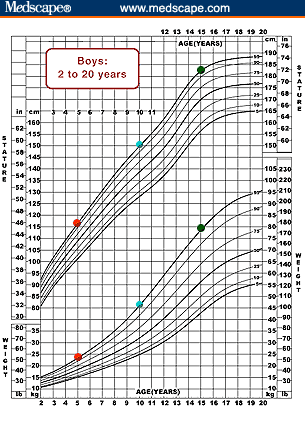
- Depending on the extent of the poor caloric intake, the child's height could become "stunted," that is, the height begins descending on the growth chart.
- If the lack of nutrition is severe and continues for an extended period of time, the head growth slows down, indicating that there are not enough calories for the brain to grow at a normal rate.
Similarly, a steady increase in weight, while the child's height increases at a much slower rate, indicates she may be putting too much extra meat on her bones. This can be a good thing or an early sign of a risk of obesity.
Tips:
Put the growth chart into context. No child's growth and development is always so smooth and perfect like the lines of the chart. Kids bounce up and down the growth charts, depending on appetite, feeding issues, illnesses, brief feeding strikes, etc.
Consider other signs of good health. Does your child appear otherwise happy and healthy? Is she making nice developmental progress? If the answers are yes, a problem is less likely.
When to Worry
If your child's growth rate slows down (weight, height, or head size) and she falls below two percentile lines, then you should explore the reason for the poor growth.
Dr. P's Pearl
Don't obsess about every up and down of your infant's growth chart. It's only potentially a problem when there is a persistent downward trend, usually lasting many months.
Percentiles in infants and children, what are they for? How are they calculated?
As a child grows throughout their childhood, when they go to the pediatrician, they check growth charts to see if physical development is optimal for their age. Growth charts or percentiles help doctors and parents evaluate and monitor a child's growth. Although growth charts can provide important information, this information should not be the only diagnostic tool a clinician uses. Percentiles are an analysis of information, but each child is different and does not always have to be accurate for everyone.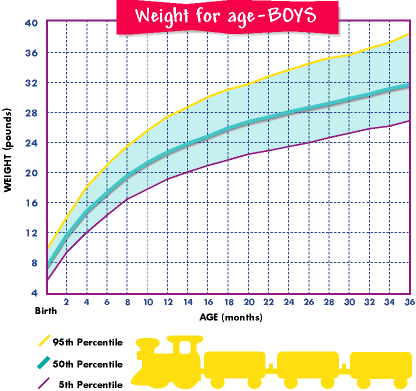
Index
- 1 What are percentiles?
- 2 Children's percentiles
- 3 Children's percentiles
- 4 How to calculate percentiles
- 5 Children's percentile chart
- 6 Girls' percentile chart
What are percentiles?
Percentiles are growth curves or charts that measure and compare children's height. regarding general and standard data. These parameters show height, weight and head circumference, which are considered normal at a certain age, taking into account, first of all, the first years of a baby's life. But it should be noted that every child is a world, and that the doctor himself will evaluate whether the boy or girl is really within the normal range or if there is something to be considered regarding their health.
Growth curves contain a set of percentiles ranging from 5 to 95%. Doctors measure the circumference of the child's head, in children under 3 years old - weight and height.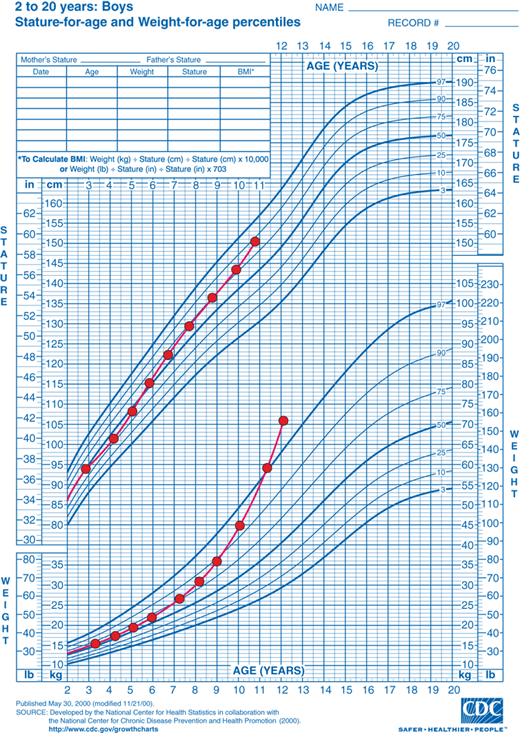 After collecting this data, the doctor plots the growth according to the child's age.
Weight, height and head circumference, if they fall within the graph, will indicate the percentile. This is adequate. Percentiles are a way to compare your child to other children. Higher percentages indicate a fatter or taller child, while lower percentages indicate a lighter or shorter child.
For example, a girl with the 75th weight percentile would be above 75 girls out of 100 and less than 25 girls out of 100. Percentiles also allow the clinician to compare height and weight to determine proportionate height. A child with a 90th percentile weight and 25th percentile height is likely to be too heavy for their height; whereas a child with the 50th percentile of height and weight has a good ratio.
Child Percentiles
If you want to know if your child's percentiles match their birth age, the first thing you need to do is Consult your pediatrician to determine suitable parameters. . The best percentile charts are the ones your pediatrician will have as they are likely to be based on the WHO charts. The percentile will display your child's weight or height on the growth chart (he may be above or below average), and you have nothing to worry about as they are standard values and everything is fine unless your pediatrician sees something unusual. ordinary, in which case they will have to tell you about it.
The growth of infants and children is influenced by many external factors, such as feeding or movement, but there is also a great deal of genetic influence. Even if your child or toddler is above or below the standard height, if they are happy, alert, active and in good health, they will rarely suffer from problems. Percentile charts should only be a guide for you, but your pediatrician will always evaluate your child's growth, development, and health.
Percentile children
The same happens with infant percentiles in infant percentiles are indicative values and should not be of any concern.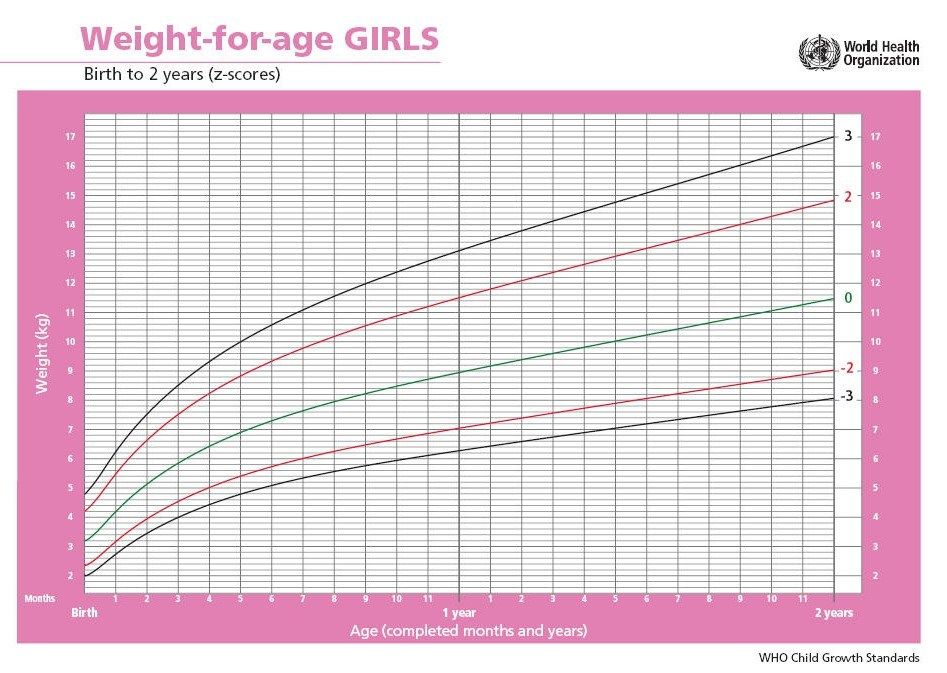 Although, if a child may be obese for his age, it would be wise for parents to take action in his life, not only because of what they invest in the percentile, but also for the good of his health.
Si the doctor appreciates that parents should take some action In particular, thanks to the data in the growth chart and the data that your child has regarding his weight, height and age, they will immediately inform the parents in order to find the best health solutions baby.
How to calculate percentile
Childhood obesity is a serious problem Millions of children in our society are overweight. Children under 6 years of age are overweight due to malnutrition and a sedentary lifestyle. Obesity can cause developmental and health problems in children, and percentiles can be a great tool to determine if a child is on the path to becoming obese.
But in addition to physical health problems, there can also be emotional health problems that lead to low self-esteem in children when they feel that their body image is negative.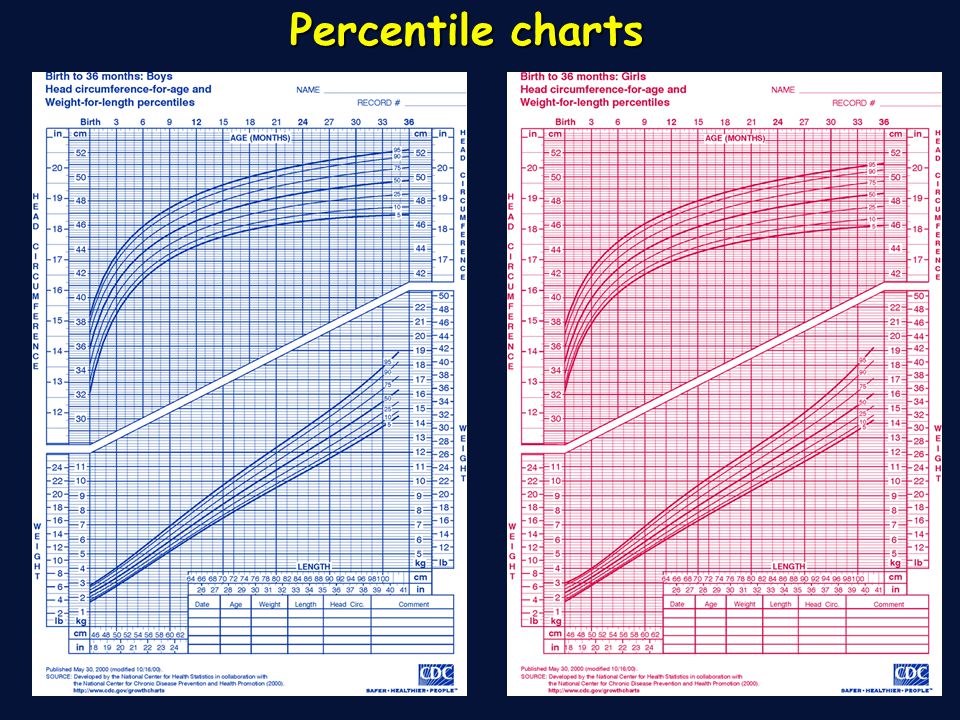
You can find calculators online to automatically calculate your children's percentile, but you can also do it yourself with or without the help of a doctor. To calculate the percentile, you must first calculate your BMI (body mass index), where will give you your ideal weight based on your current weight and height. You must remember that BMI does not calculate body fat, but only adequate weight based on height.
BMI is calculated by dividing weight by height in meters squared. . For example, if your three-year-old son weighs 16'250 kg and is 92 cm tall, his BMI would be 19'19. The equation to get the BMI would be 16'250 / (0 x 92). Knowing the BMI is not enough to know if a child is overweight, we must take into account the age and whether it is a boy or a girl.
After calculating the BMI, you should look at the growth chart of boys or girls according to the age presented by WHO, after which you can get the percentile corresponding to your son / daughter.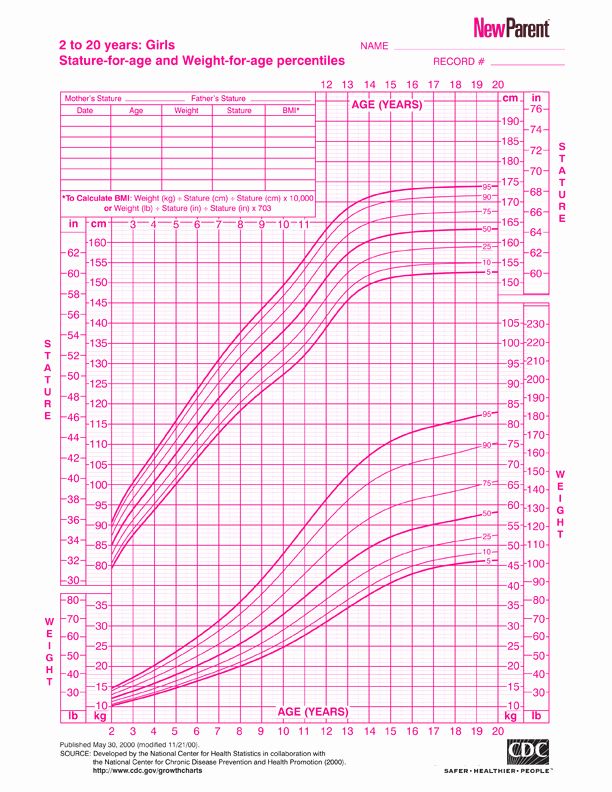 Percentiles are an indicator that will help you recognize the relative position of your BMI in relation to your peer group. The average percentile will indicate normal weight, but the lower the risk of weight loss in a child and the higher the risk of being obese or overweight. WHO classification of children:
- Percentile less than 5: underweight
- Percentile 5 to 85: normal weight.
- 85 to 95 percentile: overweight.
- Over 95 percentile: obesity
In BMI, the values would be:
- Less than 18: underweight.
- 18 to 24.9: Normal
- 25 to 26.9: overweight
- Over 27: obese
- From 27 to 29.9: obesity I degree
- From 30 to 39.9: obesity of the II degree.
- Over 40 years of age: III degree obesity
Children percentile table
Girls percentile table
The content of the article complies with our principles of editorial ethics.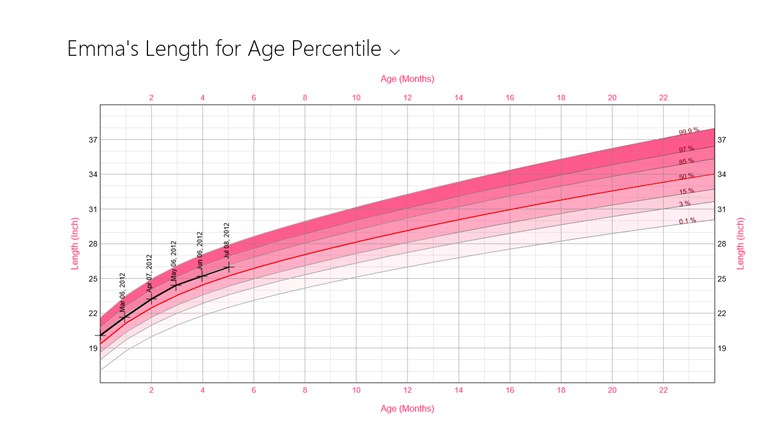 To report a bug, click here.
You may be interested in
Union of Pediatricians of Russia
Home > Information for parents > Tips for parents > Physical development of children
Body weight for age. BOYS
Birth to 5 years (percentiles)
In order to plot points on a graph, it is necessary to understand certain terms related to graphs and the rules for plotting points:
The x-axis is the horizontal coordinate axis at the bottom of the graph, which indicates the age of the child. It is necessary to put dots on the vertical lines corresponding to the full age of the baby.
Y-axis is the vertical axis of coordinates on the left side of the graph, on which body weight (kg) is indicated. It is necessary to put points on the horizontal lines corresponding to the body weight with maximum accuracy.
Plotted point - a point on the graph at which the straight line coming from the corresponding measurement on the X-axis (age) and the straight line from the measurement on the Y-axis (body weight, kg) intersect.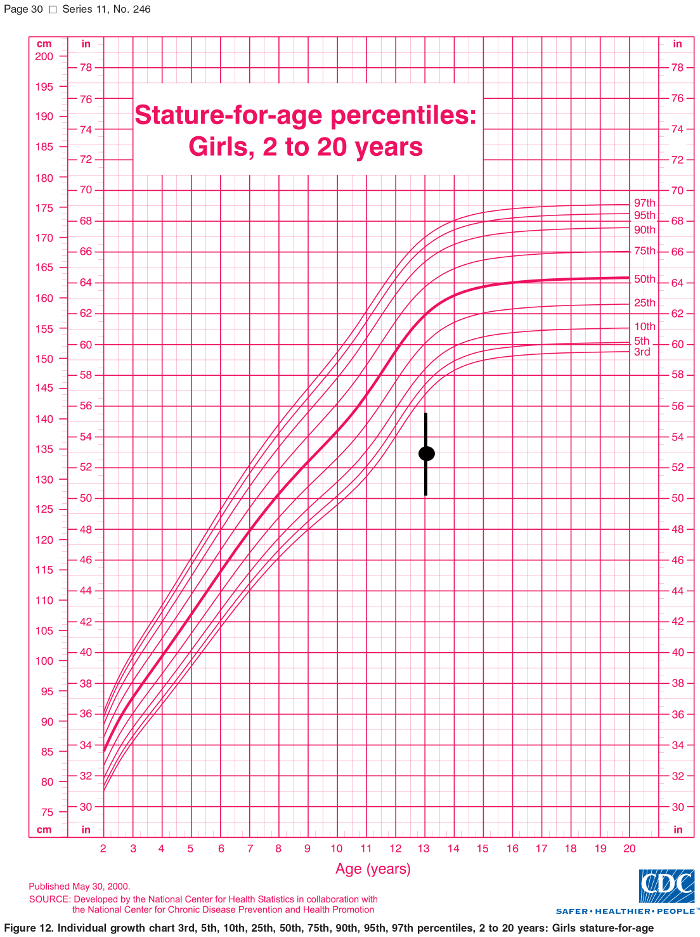
| Percentile | < 3 | 3-15 | 15-85 | 85-97 | >97 |
| Assessment of physical development | very low | below the average | average (norm) | above average | very high |
Let's analyze the example
The body weight of a girl at the age of 6 months is 5.5 kg. Let's use the graph "Body weight for age": the point on the graph is below the red curve, which means that the child has insufficient body weight and it is urgent to seek advice from a pediatrician.
Body length/height for age. BOYS
Birth to 5 years (percentiles)
In order to plot points on a graph, it is necessary to understand certain terms related to graphs and the rules for plotting points:
The x-axis is the horizontal coordinate axis at the bottom of the graph, which indicates the age of the child.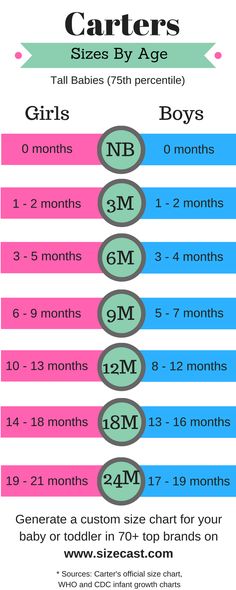 It is necessary to put dots on the vertical lines corresponding to the full age of the baby.
Y-axis is the vertical axis of coordinates on the left side of the graph, which indicates body length/height (cm). It is necessary to plot points on horizontal lines corresponding to body length/height with maximum accuracy.
Plotted point - the point on the graph where the straight line from the corresponding measurement on the X-axis (age) and the straight line from the measurement on the Y-axis (length/height, cm) intersect.
| Percentile | < 3 | 3-15 | 15-85 | 85-97 | >97 |
| Assessment of physical development | very low | below the average | average (norm) | above average | very high |
Let's take an example
The height of a boy at the age of 2 years is 88 cm.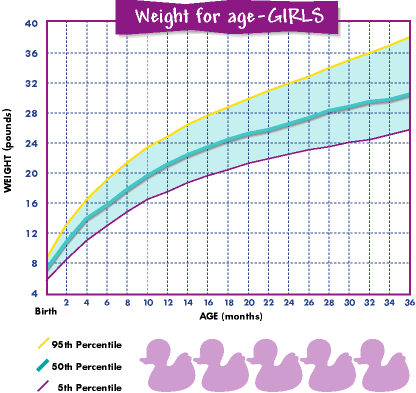 Let's use the graph "Body length / height for age": the point on the graph is located at the level of the 50th percentile, respectively, the height of the child is within the average values for his age.
Body weight to body length. BOYS
Birth to 2 years (percentiles) 2 to 5 years (percentiles)
Body weight for length/height
In order to plot points on a graph, it is necessary to understand certain terms related to graphs and the rules for drawing points: X-axis - the horizontal coordinate axis at the bottom of the graph, which indicates the length of the body / height of the child (cm). It is necessary to put dots on the vertical lines corresponding to the full age of the baby.
Y-axis is the vertical axis of coordinates on the left side of the graph, on which body weight (kg) is indicated. It is necessary to put points on the horizontal lines corresponding to the body weight with maximum accuracy.