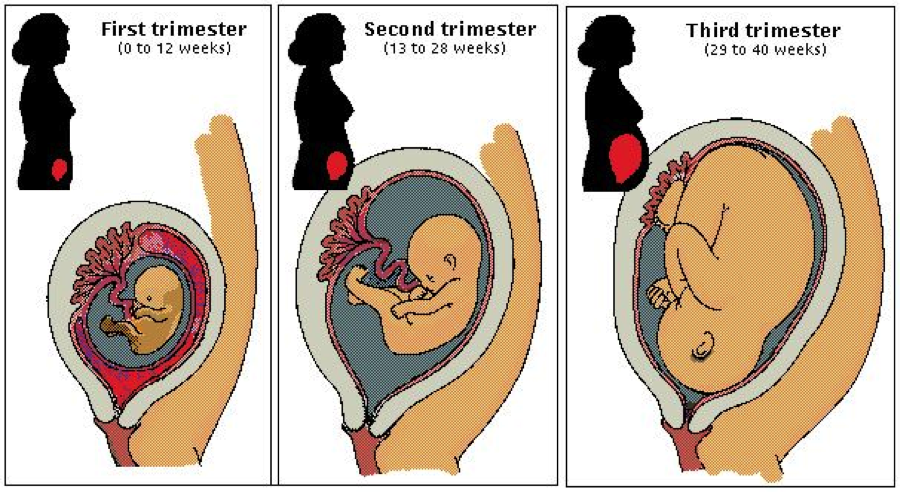
Newborn birth weight percentile
Birth Weight Percentile Calculator
Created by Dominika Śmiałek, MD, PhD candidate
Reviewed by Dominik Czernia, PhD and Jack Bowater
Based on research by
Villar J, Cheikh Ismail L, Victora CG, Ohuma EO, Bertino E, Altman DG, Lambert A, Papageorghiou AT, Carvalho M, Jaffer YA, Gravett MG, Purwar M, Frederick IO, Noble AJ, Pang R, Barros FC, Chumlea C, Bhutta ZA, Kennedy SH “International Fetal and Newborn Growth Consortium for the 21st Century (INTERGROWTH-21st). International standards for newborn weight, length, and head circumference by gestational age and sex: the Newborn Cross-Sectional Study of the INTERGROWTH-21st Project“ Lancet (September 2014)See 1 more source
Hadlock FP, Harrist RB, Martinez-Poyer J. “In utero analysis of fetal growth: a sonographic weight standard.“ Radiology (October 1991)
Last updated: Jan 05, 2023
Table of contents:- Average baby weight by a week of delivery ⏳
- Average weight of newborn baby 👶
- Abnormal newborn weight causes
- Birth weight percentile calculator ⚖️
- Newborn weight percentile calculator in practice
- FAQ
Are you looking for a tool to estimate your baby's weight at birth, regardless of their gestational age? Use this birth weight percentile calculator to find out where among their peers your child places. It not only shows the average weight of a newborn baby, but this calculator also adjusts their weight according to the week of pregnancy in which the baby was delivered (take a look at the due date calculator).
In the article below, you can find some information on the average newborn weight, according to the weight percentile calculator, the average newborn weight classification, and an explanation of how to use this birth weight percentile calculator.
Average baby weight by a week of delivery ⏳
The weight of a baby at birth differs depending on their age when they are delivered, which causes their adjusted age to differ. To assess this parameter, we use the adjusted age calculator. The age from which a baby can survive outside the uterus is 24 weeks old.
On the other side are babies that are 41 weeks old. If they're not born before that time, induction of delivery is necessary to prevent complications, such as meconium aspiration.
Because of such a wide range of possible pregnancy length, the average weight of a newborn baby may also vary.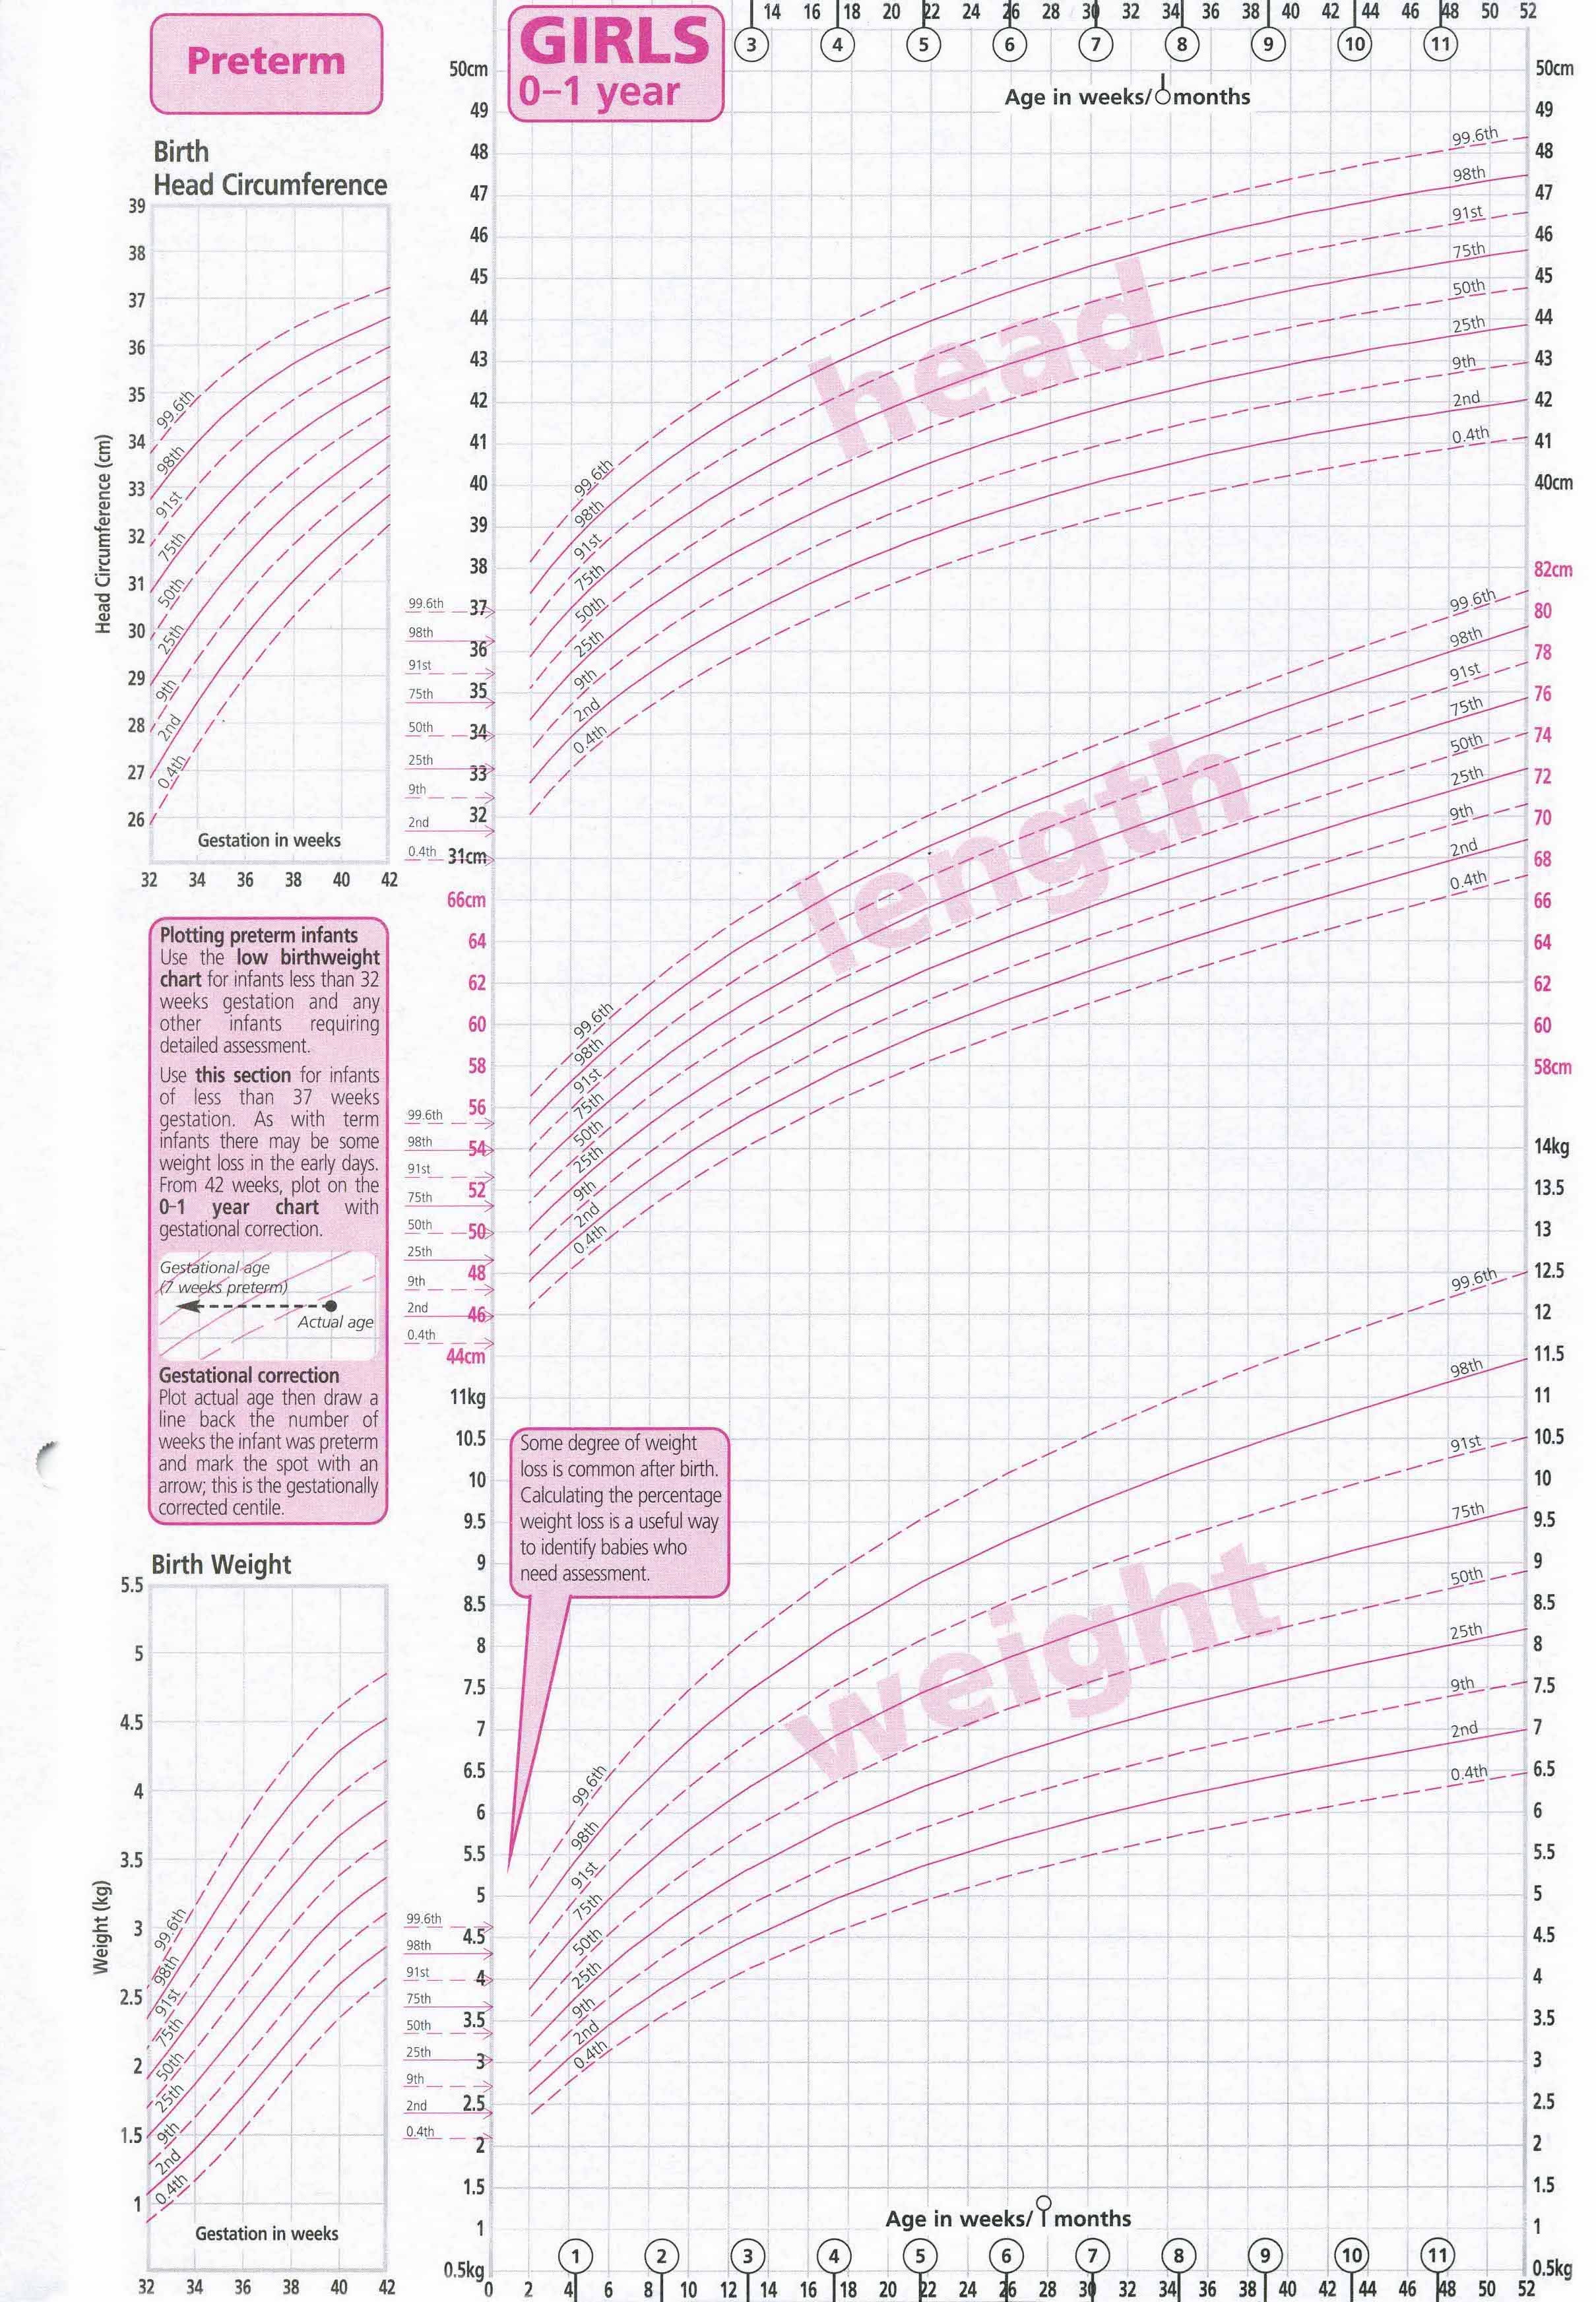
Average weight of newborn baby 👶
The average birth weight for newborns born full-term is between 5.5 lb (2.5 kg) and 8.8 lb (4 kg).
What is the classification?
- Extremely low birth weight (ELBW) is a term used for infants who weigh less than 1,000 g at birth (2.2 lb).
- Very low birth weight (VLBW) describes babies born weighing less than 1,500 grams (3.3 lb).
- Low birth weight (LBW) is when a baby's weight is less than 2,500 g (5.5 lb), no matter the gestational age.
- Normal weight (NBW) is if the baby weight is between 2,500 and 4,000 g (5.5 - 8.8 lb)
- High birth weight (HBW) is for babies born weighing more than 4 kg (8.8 lb).
There are more babies every year born at both extremes - with HBW and LBW. What are the reasons? For HBW mostly the increasing quality of life and the number of metabolic and chronic diseases among mothers, such as diabetes.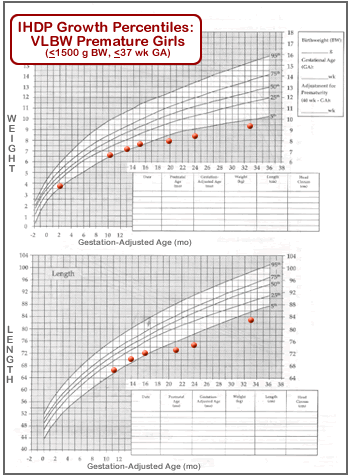 For babies with a low birth weight, developments in medicine and healthcare mean that they are now more likely to survive in utero. Also, children from multiple pregnancies, such as twins, triplets, etc. tend to be delivered preterm and with a weight lower than the average.
Infants with ELBW, VLBW, or LBW are at a high risk of complications such as hypothermia, hypoglycemia, perinatal asphyxia, respiratory distress, anemia, impaired nutrition 🍼, infection, neurological trouble, and hearing problems.
Abnormal newborn weight causes
A preterm birth (before week 38) or slow prenatal growth may cause low birth weight. There are however other causes, such as genetic factors, maternal health issues, or problems with the placenta. 👩
A weight over 4 kg is usually due to a big baby, or the mother gaining more weight than average, according to the pregnancy weight gain calculator, during the whole pregnancy. Again, the cause may be genetic or due to maternal issues (such as diabetes).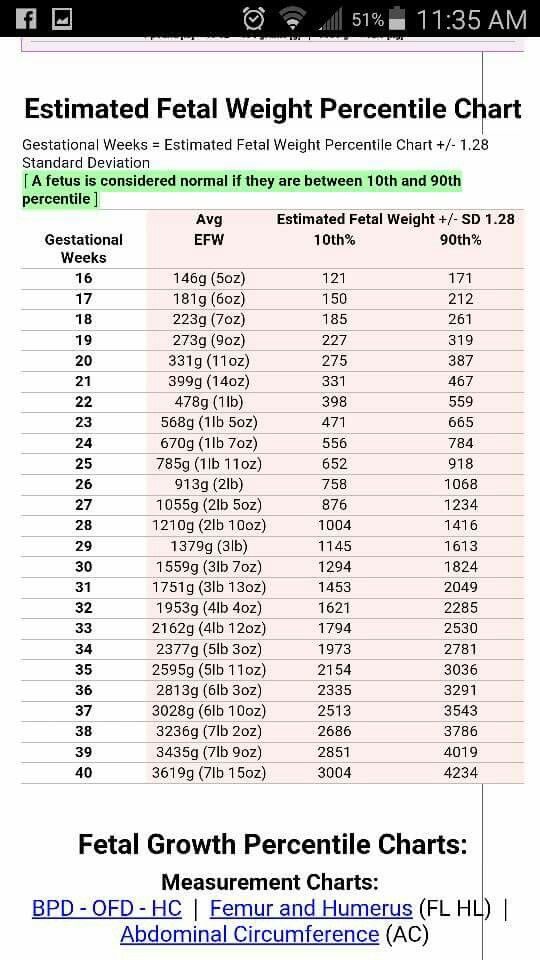
Birth weight percentile calculator ⚖️
To estimate the newborn weight percentile, you only need to know two values. The first one is the gestational age of the baby at birth, given in weeks. The second one is their weight.
Once you put in the data, the result - the exact percentile - will appear. The result is estimated based on the fetal weight equation proposed by Hadlock et al.
Below the calculator you can see a birth weight percentile chart with percentiles marked in different colors. The 50th percentile is the average weight of a newborn baby. It means that 50% of babies born at that age weigh more than this value and 50% weigh less. Your result is a dark dot, found somewhere between the percentile lines. The X values are the gestational age at which the baby may be born (between 24 and 41 weeks), and the Y values are weight. The color lines are percentile lines to help you read where your result is.
Newborn weight percentile calculator in practice
Let's work on an example of a newborn weight percentile calculation.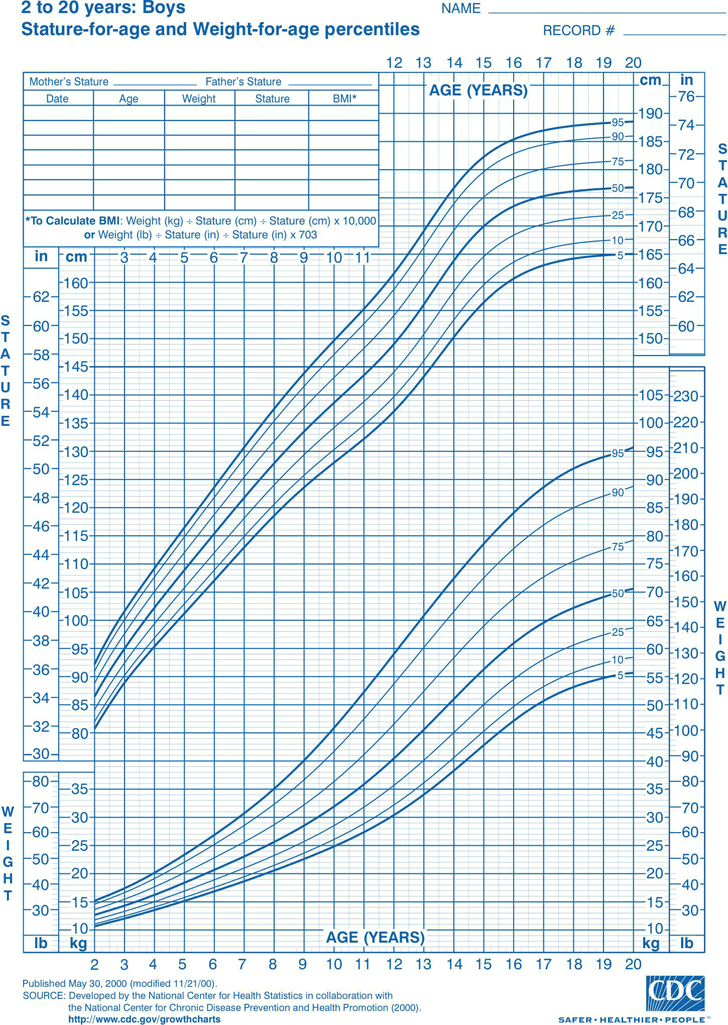 Lucy, born yesterday, was born in the 35th week of pregnancy, a bit too early. The neonatologist wants to calculate the percentile she's in according to her weight. The physician knows that preterm birth is a cause of low weight relative to children born on their due date. She uses this birth weight percentile calculator to estimate how Lucy's weight compares with the other children born at week 35.
She weighs 2350 g (5.181 lb). According to our calculator, that puts her between the 25th and 50th percentile (to be precise, the 43.42th percentile). This means that a little more than 50% of the children born at 35 week of pregnancy weight more, while a little more than 40% of infants have a lower weight than her. She has a perfectly normal body mass!
FAQ
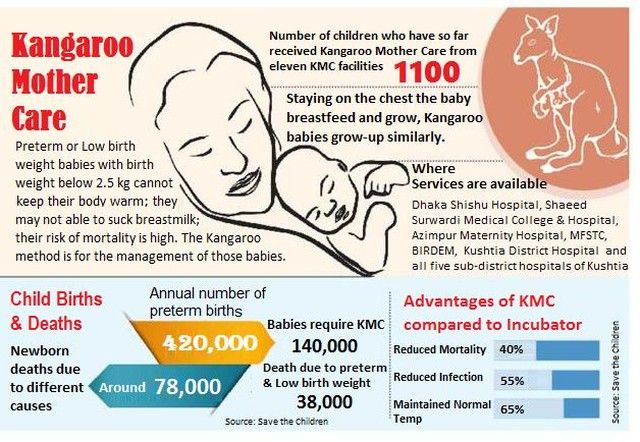
How do we call babies with birth weight lower than the average?
Such a baby can be classified as either:
- Low birth weight (LBW): 1500–2500 grams;
- Very low birth weight (VLBW): 1000–1500 grams;
- Extremely low birth weight (ELBW): 750–1000 grams; or
- Incredibly low birth weight (ILBW) (which is very rare): 500–750 grams.
What do we need to know to estimate the newborn weight percentile?
The tables for birth weight percentiles require these data points:
- Gestational age at the time of birth;
- Gender of a baby; and
- Current weight of a baby.
How to estimate the birth weight percentile?
We estimate the newborn percentile using the birth weight percentile curves or tables. Such graphs require us to know the gestational age, gender and weight of a baby. All these points of information allow us to find the specific place on a curve and compare your baby's growth to that of the general population.
Why is my baby losing weight after birth?
It is entirely normal for a baby to lose around 7–10% of their weight soon after birth. The weight loss is primarily due to the excretion of their first urine and stool. The baby will regain the lost weight during the next 2 weeks.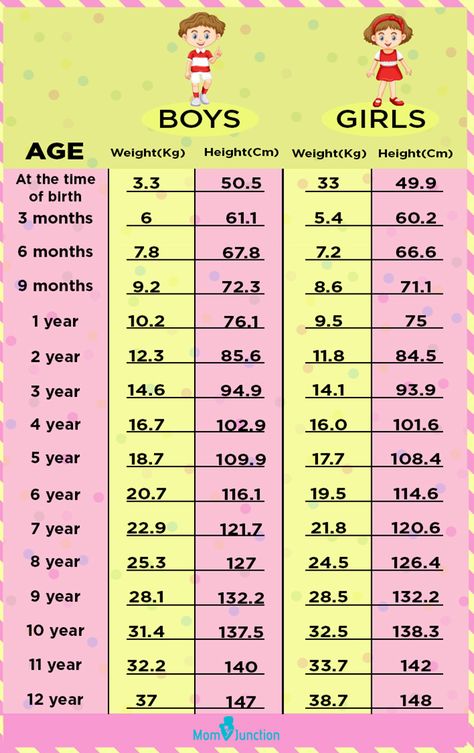
Dominika Śmiałek, MD, PhD candidate
Gestational age
Weight
Percentile
Check out 7 similar percentile calculators 👶
Baby percentileChild BMI percentileChild height percentile… 4 more
Weight For Age WHO 0-2 Year
English | 中文版
Weight Age 0-2 Length Age 0-2 Weight Length 0-2 Head Circum 0-2
Was this useful to you? Help others and share.
Description:
Note, the CDC recommends the use of the WHO charts for babies and infants from birth to two years of age. This app uses WHO tables and data for calculations.
This calculator provides your baby's weight percentile based on age. The percentile shows how your infant's weight compares to other infants. The percentile tells you what percentage of babies weigh less than your baby. For example out of a sample of 100 babies, a percentile value of 40 percent means your baby weighs more than 40 babies and weighs less than the other 60 babies.
A percentile of 50% represents the average or mean weight. A value below 50 percent means a baby weighs less than the average. A value greater than 50 percent means a baby is above average. This does not mean your baby is overweight or underweight. A doctor or physician should be consulted to determine weight status.
Calculation Instructions:
- Note, this calculator uses the World Health Organization (WHO) infant charts for 0-2 year olds
- Enter Birthday
- Enter Measurement Date
- Enter Weight
Outputs:
- Percentile - The weight percentile of the child.
- Age - The age of the child in months
- Weight - The mass of the child in metric and standard units.
- Graph Plot - Weight versus age graph with 5, 10, 25, 50, 75, 95 and calculated percentile lines.
Reference:
"The WHO Child Growth Standards". The World Health Organization.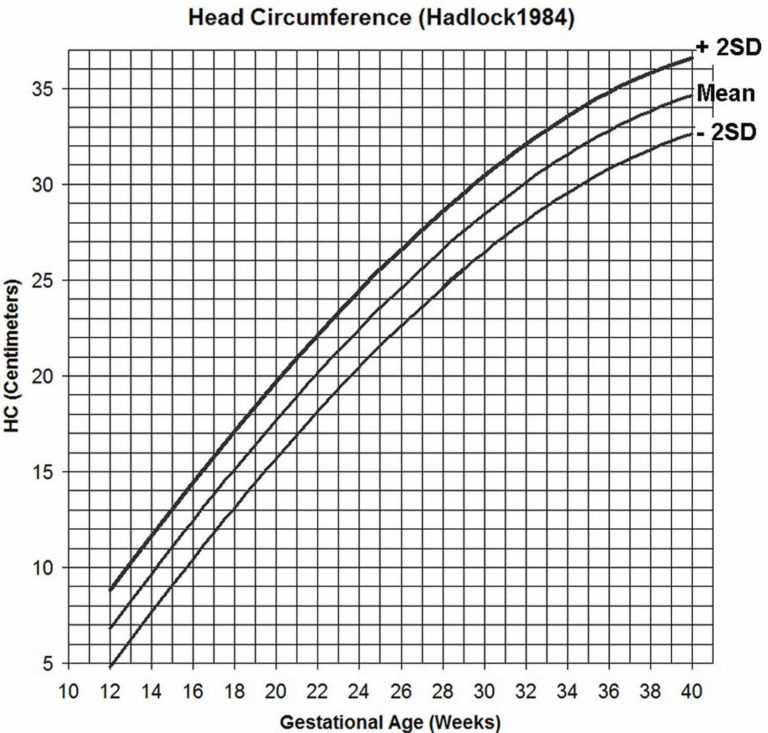 https://www.who.int/toolkits/child-growth-standards/standards.
Child Height Predictor:
Child Height Predictor - Predict Adult Height
CDC Recommended Growth Charts:
The United States Center for Disease Control (CDC) recommends using the World Health Organization (WHO) charts for the first two year of life (0 to 2 years). After two years, it is recommended to return to the CDC charts.
Weight-Age (WHO 0-2 years) Length-Age (WHO 0-2 years) Weight-Length (WHO 0-2 years) Head Circumference-Age (WHO 0-2 years)
Weight-Age (CDC 2-20 Years) Stature-Age (CDC 2-20 Years) Weight-Stature (CDC 2-20 Years)
CDC Growth Charts:
Weight-Age (CDC 0-3 years) Length-Age (CDC 0-3 years) Weight-Length (CDC 0-3 years) Head Circumference-Age (CDC 0-3 years) Weight-Age (CDC 2-20 Years) Stature-Age (CDC 2-20 Years) Weight-Stature (CDC 2-20 Years)
WHO Growth Charts:
Weight-Age (WHO 0-5 years) Length-Age (WHO 0-2 years) Height-Age (WHO 2-5 years) Weight-Length (WHO 0-2 years) Weight-Height (WHO 2-5 years) Head Circumference-Age (WHO 0-5 years)
Chinese Growth Charts:
Weight-Age (China 0-18 years) Length-Age (China 0-3 years) Height-Age (China 3-18 years) Head Circumference-Age (China 0-6 years) Weight-Length (China 0-3 years) Weight-Height (China 3-18 years)
Preterm Infant Growth Charts:
Weight-Age (23-41 Gestational Weeks) Length-Age (23-41 Gestational Weeks) Head Circumference-Age (23-41 Gestational)
Email Contact and Privacy Policy:
Contact: aj@ajdesigner. com
Privacy Policy - Legal Disclaimer
Popular Pages:
Sale Discount Calculator - Percent Off Loan Calculator Mortgage Extra Payment Paycheck Overtime Rate Calculator Jobs Salary Pay Check Converter Temperature Converter Fraction Calculator - Simplify Reduce Engine Motor Horsepower Calculator Earned Value Project Management Present Worth Calculator - Finance Constant Acceleration Motion Physics Statistics Equations Formulas Mortgage Loan Calculator - Finance Weight Loss Diet Calculator Body Mass Index BMI Calculator Light Bulb Energy Cost Analysis Automobile Fuel Economy - Gasoline Tire Size Comparison Calculator Water Pump Calculator - Hydraulics Geometry Square Circle Cylinder Triangle Calculator Torque Calculator Density Calculator Pressure Calculator Power Calculator Force Calculator
Disclaimer:
Use this calculator at your own risk.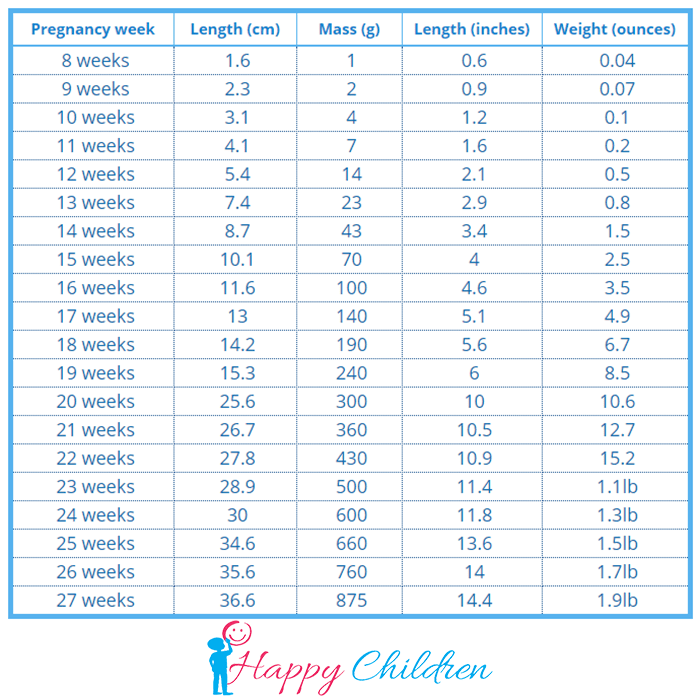 This calculator may or may not be accurate or reliable. By using this calculator you acknowledge any reliance on this calculator shall be at your sole risk.
AJ Design Software:
Technical Tools, Specifications, How to Guides, Training, Applications, Examples, Tutorials, Reviews, Answers, Test Review Resources, Analysis, Homework Solutions, Help, Data and Information for Engineers, Technicians, Teachers, Tutors, Researchers, K-12 Education, College and High School Students, Science Fair Projects and Scientists
Union of Pediatricians of Russia
Body weight for age. BOYS
Birth to 5 years (percentiles)
In order to plot points on a graph, it is necessary to understand certain terms related to graphs and the rules for plotting points:
The x-axis is the horizontal coordinate axis at the bottom of the graph, which indicates the age of the child. It is necessary to put dots on the vertical lines corresponding to the full age of the baby.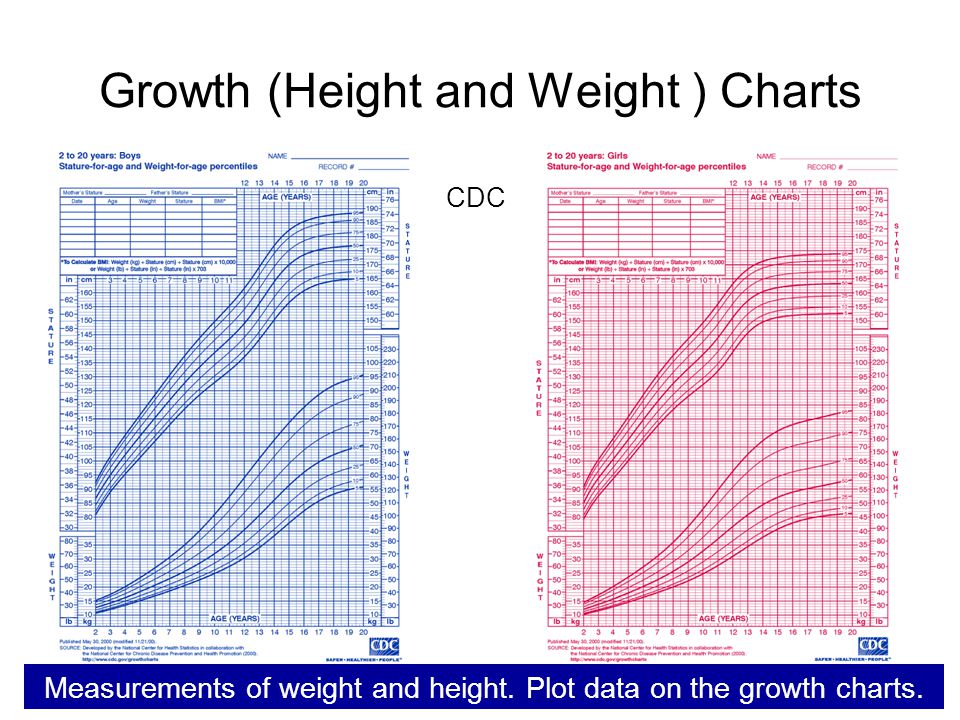 nine0007 Y-axis - the vertical coordinate axis on the left side of the graph, which indicates body weight (kg). It is necessary to put points on the horizontal lines corresponding to the body weight with maximum accuracy.
Plotted point – a point on the graph where the straight line coming from the corresponding measurement on the X-axis (age) and the straight line from the measurement on the Y-axis (body weight, kg) intersect.
| Percentile nine0024 | < 3 | 3-15 | 15-85 | 85-97 | >97 |
| Assessment of physical development | very low | below the average nine0003 | average (norm) | above average | very high |
Let's analyze the example
The body weight of a girl at the age of 6 months is 5.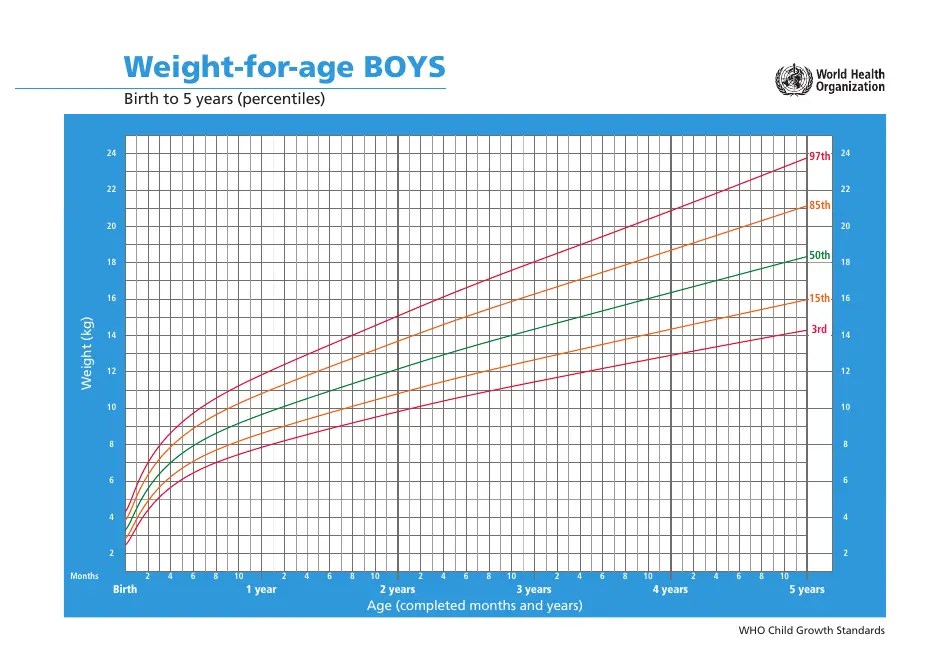 5 kg. Let's use the graph "Body weight for age": the point on the graph is below the red curve, which means that the child has insufficient body weight and it is urgent to seek advice from a pediatrician. nine0007
Body length/height for age. BOYS
Birth to 5 years (percentiles)
In order to plot points on a graph, it is necessary to understand certain terms related to graphs and the rules for plotting points:
The x-axis is the horizontal coordinate axis at the bottom of the graph, which indicates the age of the child. It is necessary to put dots on the vertical lines corresponding to the full age of the baby.
Y-axis - the vertical coordinate axis on the left side of the graph, which indicates the length of the body / height (cm). It is necessary to plot points on horizontal lines corresponding to body length/height with maximum accuracy. nine0007 Plotted point - the point on the graph where the straight line from the corresponding measurement on the X-axis (age) and the straight line from the measurement on the Y-axis (length/height, cm) intersect.
| Percentile | < 3 | 3-15 | 15-85 nine0003 | 85-97 | >97 |
| Assessment of physical development | very low | below the average | average (norm) | above average | nine0019
Let's look at the example
The height of a boy at the age of 2 years is 88 cm. Let's use the graph "Body length / height for age": the point on the graph is located at the level of the 50th percentile, respectively, the height of the child is within the average values for his age.
Body weight to body length. BOYS
BOYS
Birth to 2 years (percentiles) 2 to 5 years (percentiles) nine0003
Body weight for length/height
In order to plot points on a graph, it is necessary to understand certain terms related to graphs and the rules for drawing points: X-axis - the horizontal coordinate axis at the bottom of the graph, which indicates the length of the body / height of the child (cm). It is necessary to put dots on the vertical lines corresponding to the full age of the baby.
Y-axis - the vertical coordinate axis on the left side of the graph, which indicates body weight (kg). It is necessary to put points on the horizontal lines corresponding to the body weight with maximum accuracy. nine0007 Plotted point - a point on the graph where the straight line from the respective measurement on the X-axis (length/height, cm) and the straight line from the measurement on the Y-axis (body weight, kg) intersect.
| Percentile | < 3 | 3-15 | nine0026 15-85 | 85-97 | >97 |
| Assessment of physical development | very low | below the average | average (norm) nine0003 | above average | very high |
Let's look at the example
The girl's body weight is 17 kg, height is 99 cm.


