How big will baby be
You Can Predict Your Newborn's Weight
Equation Just as Good as Ultrasound, Easier to Use
Sept. 26, 2002 - A new baby's gender, name, time of birth, and birth weight are nice information for a birth announcement, but birth weight is especially important for an obstetrician. A large size at delivery has long been associated with an increased risk of injuries to a newborn and its mom. So the better a doctor can predict birth weight, the easier the delivery may be.
Most of the time, birth weight is predicted with ultrasound. Now researchers say a mathematic equation is just as good a predictor and can predict birth weight earlier than ultrasound for some newborns.
Duke University Medical Center doctors tested the accuracy of an equation that calculated birth weight based on stage of pregnancy, mother's height and weight, third-trimester weight gain rate, the number of other children, and fetal sex.
When they used it for 244 women who gave birth to single babies, the equationaccurately predicted birth weight within an average of 8% of actual birth weight. For 87% of the births, weight was predicted within 15% of the actual weight. Ultrasound is estimated to predict within 8-15% of true birth weight.
It was also easier for doctors to identify babies who might be bigger than 8.8 pounds, a weight at which the risk of delivery problems begin to increase.
The researchers say the equation is easier to use and more efficient than ultrasound. "The equation requires no additional testing, trained staffing, or equipment, and the information needed can be gleaned from the mother's current medical records," says Gerard Nahum, MD, of Duke's department of obstetrics and gynecology. "It can be computed by most doctors in about two to three minutes," he says in a news release.
The mathematical formula does have its limitations. The study looked at only white nonsmokers who didn't have high blood pressure or diabetes and who gave birth to a single baby after 37-42 weeks of pregnancy. Researchers say others were excluded because differences in racial groups are linked to differences in birth weight. And high blood pressure and premature birth are linked to low birth weight while diabetes is linked to high birth weight.
A key to the equation's accuracy is knowing exactly -- or nearly exactly -- how long a woman has been pregnant, which is calculated using the last day of the her last period or by analyzing an early ultrasound.
Nahum says the equation also can be used early in the third trimester, since most women see their doctors every two weeks by that time. Third-trimester weight gain can be calculated once the woman has been weighed twice during the third trimester.
For those of you who have a thing for math, here's the equation:
Birth weight (g) = gestational age (days) x (9.38 + 0.264 x fetal sex + 0.000233 x maternal height [cm] x maternal weight at 26.0 weeks [kg] + 4.62 x 3rd-trimester maternal weight gain rate [kg/d]] x [number of previous births + 1]).
Pointers for performing the calculations:
- Perform all multiplications before the additions.

- Gestational age is the stage of your pregnancy in days, or days since the onset of your last normal menstrual period plus 14.
- For fetal sex, use 1 for a boy, -1 for a girl, or 0 if sex is unknown.
- For mother's height, inches multiplied by 2.54 gives you centimeters.
- For the mother's weight, pounds divided by 2.2 gives you kilograms.
- For the baby's birth weight, take the number from your calculation and divide by 453 to get your baby's estimated weight in pounds.
If you don't have a thing for math, you might want to show this to your obstetrician. -->
Today on Grow
Recommended for You
Doctor-approved information to keep you and your family healthy and happy.
- Pregnancy & Baby Bulletin
- Parenting & Children's Health

Baby size by week | BabyCenter
- Pregnancy
- Your Body
By Karen Miles
|
|
July 6, 2021
Find out how big your baby is during each week of their development with our fetal growth chart. From early in pregnancy, babies grow at different rates, so these numbers are merely averages. Your baby's actual size by week (in length and weight) may vary substantially.
Photo credit: Thinkstock
How big is my baby?
Wondering how big your baby is during each week of pregnancy? The numbers in our chart below can give you a sense of your baby's size. Keep in mind that your baby may be much smaller or larger than these averages. That's okay – after all, healthy babies can weigh less than 5 pounds or more than 9 pounds at birth.
Boy's measurements are different than girl's measurements, even this early. For the numbers on our chart, we've taken an average of boys and girls.
Another thing to note: Until 14 weeks, a baby's length measurement is given from head to bottom. After 14 weeks, the measurement given is from head to toe.
If you're curious, see our pregnancy timing article to learn how the weeks of pregnancy are counted. And if you don't know your due date, use our due date calculator to find out.
Fetal growth chart
| Gestational age | Length (US) | Weight (US) | Length (cm) | Mass (g) |
| (head to bottom) | (head to bottom) | |||
| 10 weeks | 1.22 inch | 1.23 ounces | 3.1 cm | 35 grams |
| 11 weeks | 1.61 inch | 1.59 ounces | 4.1 cm | 45 grams |
| 12 weeks | 2.13 inches | 2. 05 ounces 05 ounces | 5.4 cm | 58 grams |
| 13 weeks | 2.64 inches | 2.58 ounces | 6.7 cm | 73 grams |
| (head to toe) | (head to toe) | |||
| 14 weeks | 5.79 inches | 3.28 ounces | 14.7cm | 93 grams |
| 15 weeks | 6.57 inches | 4.13 ounces | 16.7 cm | 117 grams |
| 16 weeks | 7.32 inches | 5.15 ounces | 18.6 cm | 146 grams |
| 17 weeks | 8.03 inches | 6.38 ounces | 20.4 cm | 181 grams |
| 18 weeks | 8.74 inches | 7.87 ounces | 22.2 cm | 223 grams |
| 19 weeks | 9.45 inches | 9.63 ounces | 24.0 cm | 273 grams |
| 20 weeks | 10. 12 inches 12 inches | 11.68 ounces | 25.7 cm | 331 grams |
| 21 weeks | 10.79 inches | 14.07 ounces | 27.4 cm | 399 grams |
| 22 weeks | 11.42 inches | 1.05 pounds | 29.0 cm | 478 grams |
| 23 weeks | 12.05 inches | 1.25 pounds | 30.6 cm | 568 grams |
| 24 weeks | 12.68 inches | 1.48 pounds | 32.2 cm | 670 grams |
| 25 weeks | 13.27 inches | 1.73 pounds | 33.7 cm | 785 grams |
| 26 weeks | 13.82 inches | 2.01 pounds | 35.1 cm | 913 grams |
| 27 weeks | 14.41 inches | 2.33 pounds | 36.6 cm | 1055 grams |
| 28 weeks | 14.80 inches | 2. 67 pounds 67 pounds | 37.6 cm | 1210 grams |
| 29 weeks | 15.47 inches | 3.04 pounds | 39.3 cm | 1379 grams |
| 30 weeks | 15.95 inches | 3.44 pounds | 40.5 cm | 1559 grams |
| 31 weeks | 16.46 inches | 3.86 pounds | 41.8 cm | 1751 grams |
| 32 weeks | 16.93 inches | 4.31 pounds | 43.0 cm | 1702 grams |
| 33 weeks | 17.36 inches | 4.77 pounds | 44.1 cm | 1953 grams |
| 34 weeks | 17.84 inches | 5.24 pounds | 45.3 cm | 2377 grams |
| 35 weeks | 18.23 inches | 5.72 pounds | 46.3 cm | 2595 grams |
| 36 weeks | 18.62 inches | 6.20 pounds | 47. 3 cm 3 cm | 2813 grams |
| 37 weeks | 19.02 inches | 6.68 pounds | 48.3 cm | 3028 grams |
| 38 weeks | 19.41 inches | 7.13 pounds | 49.3 cm | 3236 grams |
| 39 weeks | 19.72 inches | 7.57 pounds | 50.1 cm | 3435 grams |
| 40 weeks | 20.08 inches | 7.98 pounds | 51.0 cm | 3619 grams |
| 41 weeks | 20.39 inches | 8.35 pounds | 51.8 cm | 3787 grams |
Thanks to Dr. Mark Curran, maternal-fetal medicine specialist, for his help in preparation of this table.
Where to go next:
- See the ultimate pregnancy to-do list for the first, second, and third trimesters
- Use our Baby Names Finder
- Video: Watch how your body changes to make room for your growing baby
Sources
BabyCenter's editorial team is committed to providing the most helpful and trustworthy pregnancy and parenting information in the world. When creating and updating content, we rely on credible sources: respected health organizations, professional groups of doctors and other experts, and published studies in peer-reviewed journals. We believe you should always know the source of the information you're seeing. Learn more about our editorial and medical review policies.
Curran MA. 2019. Estimation of fetal weight and age. Perinatology.com. https://perinatology.com/calculators/Estimation%20of%20Fetal%20Weight%20and%20Age.htm [Accessed June 2021]
Deter RS et al. 2018. Individualized growth assessment: Conceptual framework and practical implementation for the evaluation of fetal and neonatal growth. American Journal of Obstetrics and Gynecology 208 (2 Suppl): S656-S678. https://www.ncbi.nlm.nih.gov/pmc/articles/PMC5882201/ [Accessed June 2021]
Fenton TR. 2003. A new growth chart for preterm babies: Babson and Benda's chart updated with recent data and a new format. BMC Pediatrics. https://www. ncbi.nlm.nih.gov/pmc/articles/PMC324406/pdf/1471-2431-3-13.pdf [Accessed June 2021]
Gardosi J et al. 2018. Customized growth charts: rationale, validation and clinical benefits. American Journal of Obstetrics & Gynecology 218(2): S609-S618. https://www.ajog.org/article/S0002-9378(17)32486-9/fulltext [Accessed June 2021]
Hadlock FP et al. 1984. Estimating fetal age: Computer-assisted analysis of multiple fetal growth parameters. Radiology 152 (2) https://pubs.rsna.org/doi/10.1148/radiology.152.2.6739822 [Accessed June 2021]
Hadlock FP et al. 1992. Fetal crown rump length: Reevaluation of relation to menstrual age (5-18 weeks) with high resolution real-time. US Radiology 182(2):501-5. https://pubmed.ncbi.nlm.nih.gov/1732970/ [Accessed June 2021]
Hadlock FP, et al. 1991. In utero analysis of fetal growth: a sonographic weight standard. Radiology 181(1):129-33. https://pubs.rsna.org/doi/10.1148/radiology.181.1.1887021 [Accessed June 2021]
Kiserud T et al.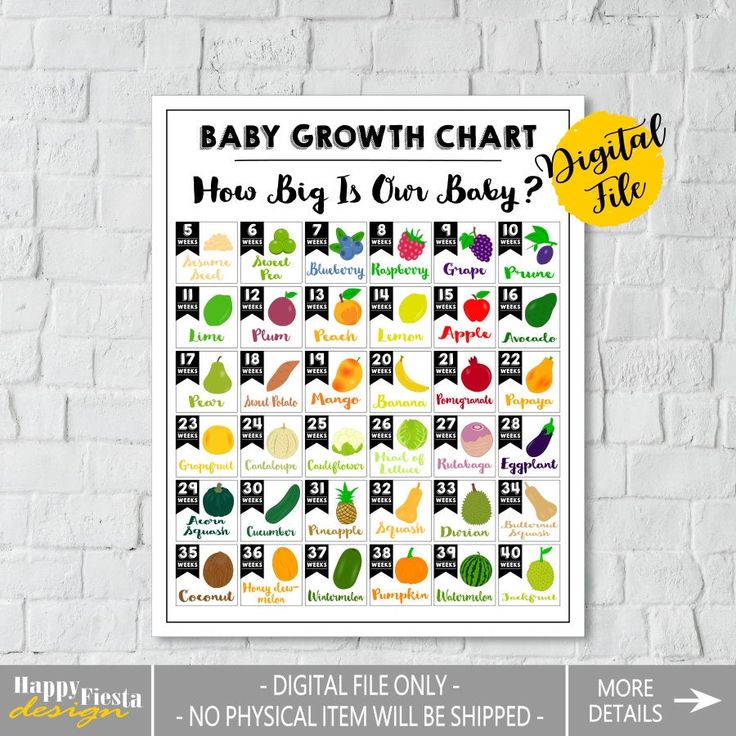 2017. The World Health Organization fetal growth charts: A multinational longitudinal study of ultrasound biometric measurements and estimated fetal weight. PLoS Medicine 14(1): e1002220. https://www.ncbi.nlm.nih.gov/pmc/articles/PMC5261648/ [Accessed June 2021]
Martins JG et al. 2020. Society for Maternal-Fetal Medicine Consult Series #52: Diagnosis and management of fetal growth restriction: (Replaces Clinical Guideline Number 3, April 2012). Practice Guideline. American Journal of Obstetrics & Gynecology 223(4): B2-B17. https://pubmed.ncbi.nlm.nih.gov/32407785/ [Accessed June 2021]
Nicolaides KH. Et al. 2018. Fetal medicine foundation fetal and neonatal population weight charts. Ultrasound in Obstetrics & Gynecology 52(1). https://obgyn.onlinelibrary.wiley.com/doi/full/10.1002/uog.19073 [Accessed June 2021]
Show more
advertisement | page continues below
advertisement
Featured video
All pregnancy, parenting, and birth videos >
Get the BabyCenter app
The #1 app for tracking pregnancy and baby growth.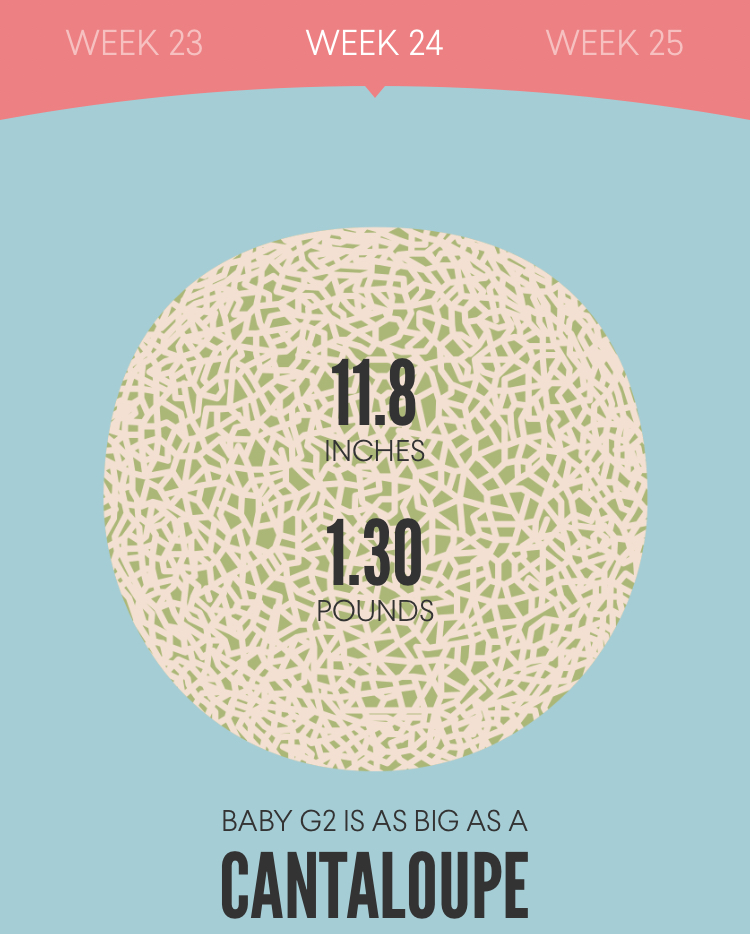
Download now
HOW MUCH YOUR CHILD GROWS | Nauka i Zhizn
Graphs of the statistical dependence of the height of the son (S) and daughter (D) on the height of their parents (P + M). The borders of the shaded area allow you to estimate what, with a probability of 90%, will be the true growth of children.
View full size
‹
›
Young parents would like to know how tall will their child be adults. In anthropometric the cabinet is usually asked: what are father's height ( P ), mothers ( M ), How tall were they at birth? how old are they now. This data immediately processed by the computer and gives a forecast: when the children grow up, then the most likely height of the daughter ( D ) or son ( C ) will be such and such. The expected growth can be estimated using a calculator, referring to doctors.
Main factor affecting the growth of children, - genetically determined growth parents.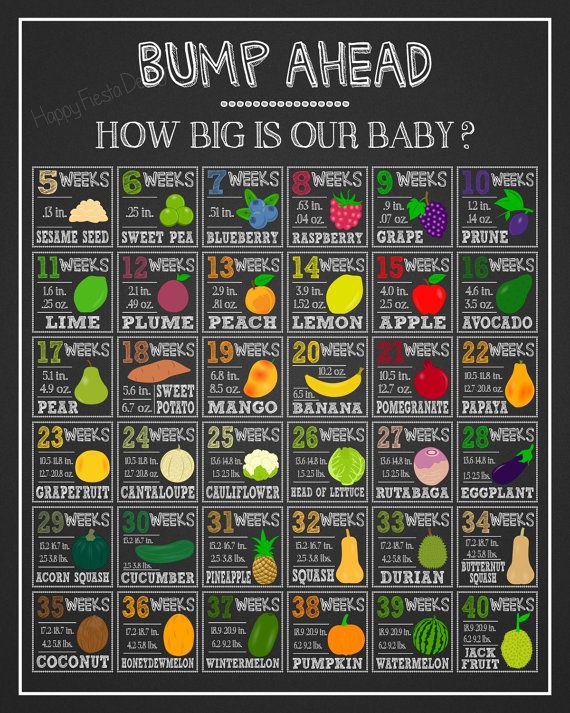 Statistical research shows that growth the child depends on him half. And the other fifty percent is much more difficult to calculate or completely impossible. It - difficult to control or completely uncontrollable image life, good and bad habits, food quality, environmental conditions habitats, mutagenic changes.
However mathematical statistics can suggest a simple linear dependence for the approximate estimates of children's growth, based only on from the growth of father and mother, as well as indicate the accuracy of such an estimate. A survey of three dozen families allowed build a statistical dependency - "point cloud" inside an ellipse stretched out right-up: really than the greater the height of the parents, the more the growth of their children. But enjoy "point cloud" is inconvenient. Mathematicians are looking for such a line or curve through it so that by setting the value on the axis abscissa, get the corresponding her value on the y-axis with perhaps a smaller error. Usually this is achieved through called the method of least squares, looking for a linear function y = Kx + b , where K - straight line slope factor (the tangent of its angle with the abscissa axis), b - segment cut off on the y-axis.
Optimal value To is calculated especially simple if by nature problem line passes through origin. In our task, Naturally, she won't go like this. (growth cannot be zero) and formulas for calculating K and b turn out to be more bulky, although not outgoing beyond school algebra.
Their output can be find in the book: Ya. B. Zeldovich, A. D. Myshkis. "Elements of the application mathematics ". M .: Nauka, 1965 and more later editions.
In our problem x \u003d P + M , y \u003d D or y \u003d C . By poll Muscovites received several tens of parental heights ( P and M ) and children ( D and C ). Calculations gave for daughter K = 0.505, b = 5 cm; for son
K = 0.57, b = 14.5 cm.
As a result for calculation of the expected growth of the daughter the formula turned out: D \u003d 0.505 ( P + + M ) - 5 cm. For example, father's height 180 cm, mother's height 161 cm, sum 341 cm. Multiplying the last value by 0.505 and subtracting 5 cm, we get expected height of an adult daughter 167.2 see formula for estimating height adult son instead of 0.505 you need take 0.57, and subtract, instead of 5 cm, 14.5 cm: C = 0.57( P + M ) - 14.5. For example, the same parents have height an adult son will be more likely total, 179.9 cm.
In theory probabilities as calculated (growth of children), and initial size (height of parents) are called random variables. Here we have found only the most probable height of an adult son and daughter. Deviations, of course are possible, they are easy to observe in brothers or sisters in full according to the law of normal distributions of random variables - the most common in nature. On the graph, this law looks like bell curve: center is the most likely the value of a random variable, on both side deviations are located, the probability of which quickly tends to zero as they increase (it is also called the Gaussian curve named after the great German mathematician Carl Gauss, who brought out analytical view of the normal distribution law - see "Science and life" No. 2, 1995). Mathematical statistics can evaluate and most likely deviations from the predicted quantities, as is often said: plus or minus something. For this needs to be set first confidence probability of the estimate - usually 90, 95 or 99%. In the case of a fairly large spread random variables it is reasonable to set 90% confidence level. Rather complex calculations allow get the so-called hyperbolic confidence regression zones (in the figure they shaded), but simply the values possible deviations from the straight line.
Final the answer should be something like this: if the height of the father is 180 cm, and the mother is 161 cm, then the most likely growth adult daughter will be 167. 5 cm, and deviation from this value will go beyond plus or minus 4 cm with 90% chance.
Volume statistical sample collected students, small - total thirty points. Therefore, the accuracy calculations are also not so hot - plus or minus 4-5 cm. In serious scientific work data processing for people is carried out on representative samples (this the term is now commonly used when publishing survey data public opinion and means that they can be generalized to very large population group) about a thousand people. Together with so it seems to us that the accuracy solution to this problem will increase not much even for large samples; apparently she won't be taller plus or minus 3-4cm due to physiological, genetic and environmental factors affecting human development. We also wanted first, to give a simple opportunity anyone who wants to satisfy him so natural self-interest. And secondly, to offer students, students of probability and mathematical statistics (which are now taking place in the broadest range of specialties), and their teachers interesting and topic close to everyone to solve statistical task. Quite maybe they get more representative samples and find more accurate and reliable formulas for growth forecast our children.
How tall a child will be can be measured not only by the height of the parents: what scientists have found out
A new study suggests that DNA is a better indicator for predicting the growth of a child than the height of the parents.
Related video
Adult height is largely determined by the information encoded in our DNA, according to a new study by scientists from the UK and Australia. It is DNA that is the best predictor of the growth of an unborn child, and not the growth of his biological parents, writes the Daily Mail.
Focus. Technology has its own Telegram channel . Subscribe to not miss the latest and exciting news from the world of science!
According to scientists, they have conducted the largest DNA analysis in history, in which they studied the DNA of 5 million people from around the world. The scientists believe their study fills a significant gap in understanding how genetic differences explain height differences between individuals.
According to Loic Yengo of the University of Queensland, Australia, 80% of differences in height between people are determined by genetic factors. Therefore, DNA research is a more accurate indicator for determining the growth of an unborn child.
"Currently, a child's height is best measured using the average height of their biological parents, but genomic data can provide a more accurate estimate of height," Yengo says.
Scientists believe that in this way parents will know how their child will develop and in this case, potential developmental problems can be immediately identified.
"Currently, a child's height is best measured using the average height of their biological parents, but genomic data can give a more accurate estimate of height," Yengo says.
Photo: Daily Mail
"There are so many health problems that can be solved with DNA research. If we can get a clear picture of growth with DNA, we can better diagnose and treat diseases that are influenced by genes, such as heart disease or schizophrenia," says Eirini Maruli from Queen Mary University of London.
According to scientists, if certain parts of the genome can be matched to certain signs of disease, personalized treatments can be developed.
The scientists think their findings could help doctors find people who can't grow to the genetically predicted level. And it will help diagnose hidden diseases that can affect growth or overall health.
But scientists want to continue their research to determine other factors that affect growth.
As Focus already wrote, scientists told which side it is better to sleep on: on the right or left.
