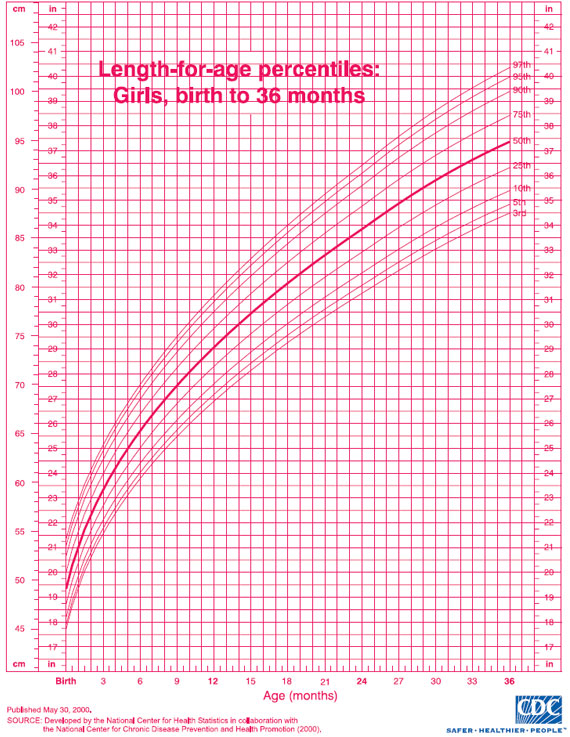
Girl baby height weight charts
Baby growth charts: Percentiles, reading a growth chart, and more
Baby growth charts track your child's growth over time and compare it to that of similar babies. Growth charts can show you how your baby's growing and alert your doctor if there's a potential problem. It's easy to get caught up in growth chart percentiles and how your baby measures up, but keep in mind that there's a wide range of normal. Also, what you see on your baby's growth chart now doesn't predict their size as an adult.
What is a baby growth chart?
A baby growth chart is a tool that your baby's doctor will use to track their growth over time and compare it to other babies the same age and sex. Growth charts were developed using measurements from thousands of children.
At every doctor visit, your baby's healthcare provider will measure:
- Your baby's weight
- Your baby's height/length (measured lying down)
- Your baby's head circumference (measured around the head above the eyebrows)
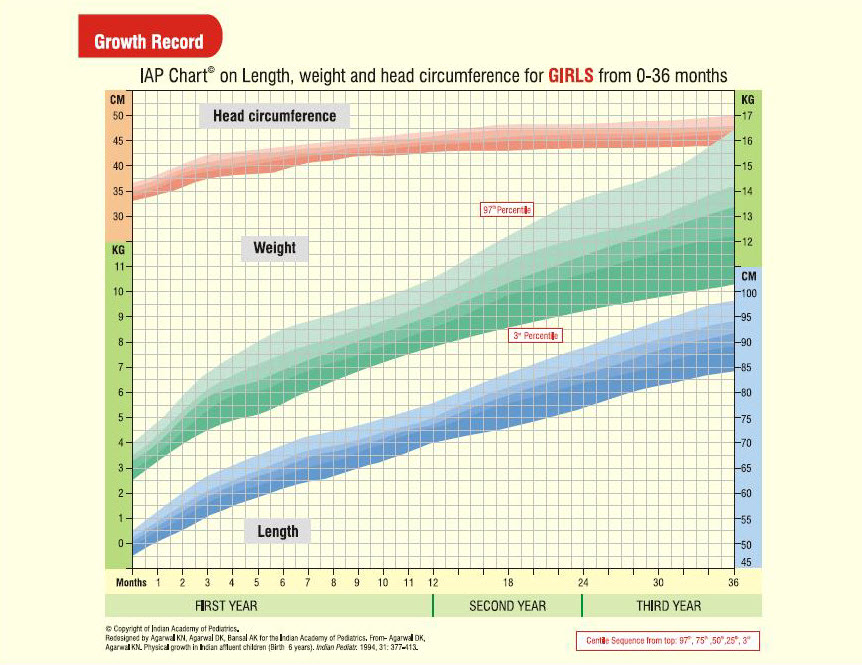
The doctor will plot these measurements on the growth chart and show it to you. Depending on where the measurements fall on the chart, you can see how your baby's growth compares to that of similar babies.
Your baby's growth chart can give you a general picture of how they're developing physically, and their doctor will use it to determine whether your baby is growing in a healthy way.
But try not to get too hung up on your baby's growth chart – it's not the last word on how your baby is doing. There's a wide range of normal, and your baby's measurements don't mean they'll be short or tall, or fat or skinny, as an adult. The most important thing is that your baby is growing at a steady, appropriate rate over time.
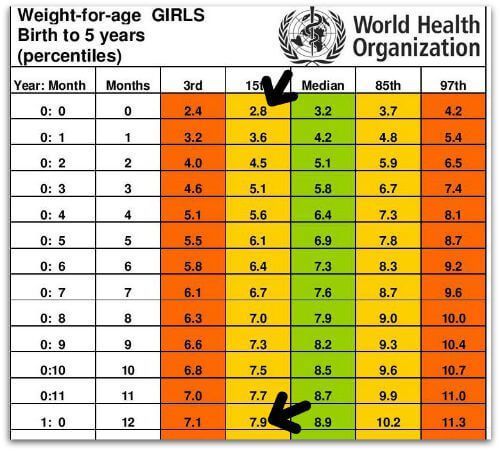
Note: The U.S. Centers for Disease Control (CDC) recommends that doctors use the charts from the World Health Organization (WHO) for the first 24 months of a child's life. After age 2, doctors typically use the CDC's growth charts, which are similar but based on different data.
The charts from both organizations show length in inches and centimeters as well as weight in pounds and kilograms.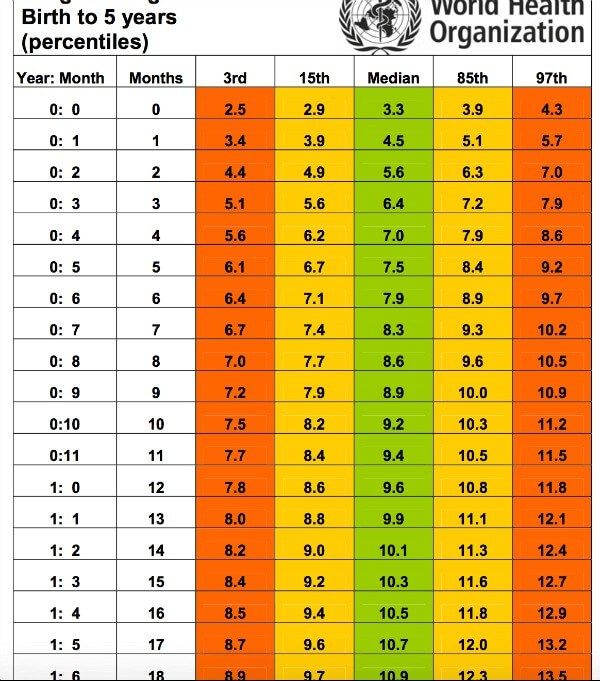 Both charts also use percentiles, which compare averages of children broken down by age.
How do growth chart percentiles work?
This is easiest to explain by example. If your 3-month-old daughter is in the 40th percentile for weight, that means 40 percent of 3-month-old girls weigh less than your baby, and 60 percent weigh more.
Advertisement | page continues below
The higher the percentile number, the bigger your baby is compared to other babies the same age. If your baby is in the 50th percentile, that means they fall right in the middle of the pack.
To chart your baby's growth at home, try our growth percentile calculator.
Percentiles in a growth chart aren't like grades in school. A higher percentile isn't better, and a lower percentile doesn't mean there's anything wrong with your baby.
Let's say both parents are shorter than average, and your baby grows up to have the same stature. It would be perfectly normal for them to rank consistently in the 10th percentile for height and weight as they grow up.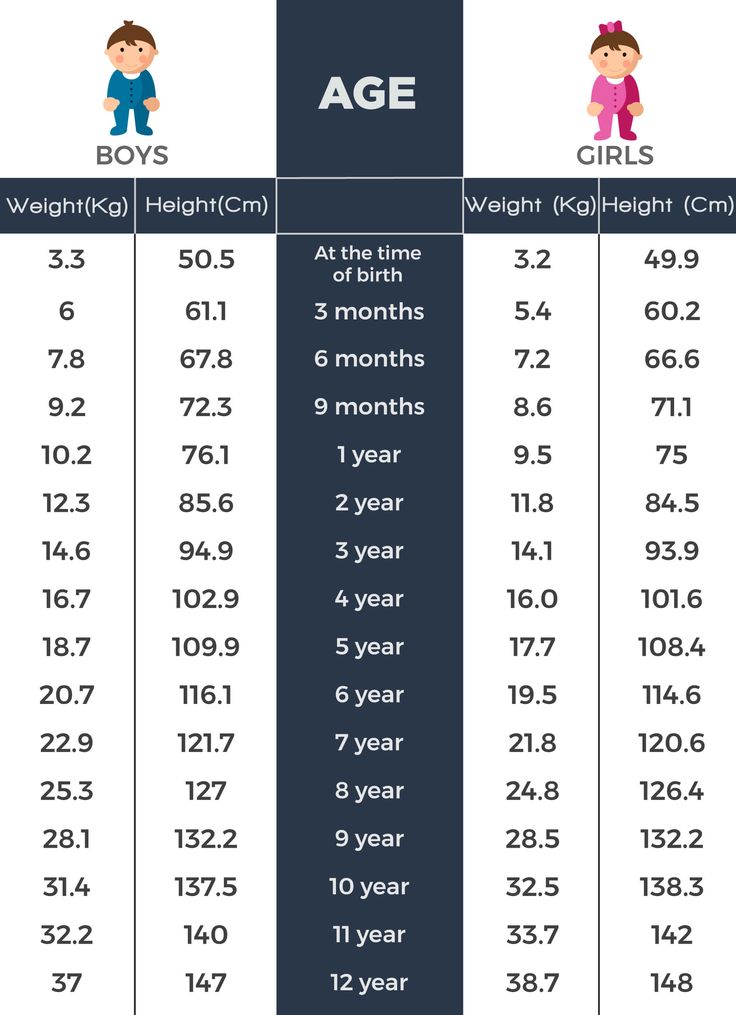
What's important to remember is that your doctor is watching how your baby grows, not just how much.
Babies tend to go through rapid growth spurts, during which they might put on a little extra weight or length. Other months they may grow only a fraction of what they normally do. Your child's doctor notes individual peaks and valleys, but they'll be more focused on the overall pattern of growth.
Should I worry about my baby's growth?
It could be cause for concern if your baby's percentile changes significantly. For example, if they're consistently been around the 50th percentile for weight and then suddenly drops into the 15th, your baby's doctor will want to figure out why. There could be a medical reason for the change that needs further evaluation.
A minor illness or a change in your baby's eating patterns might result in a smaller drop, in which case the doctor may just follow your baby's growth more closely for a while.
If your baby hasn't been sick but their weight gain is slowing down while they're still growing in length, your child's doctor may suggest increasing the number of feedings. You may have to go in for more frequent visits to make sure that your baby starts gaining weight again.
There are times when gaining or losing faster than usual is a good thing. If your baby was underweight, for example, it may be a good sign that they're gaining ounces faster than growing inches.
Also, being at one end of the growth spectrum isn't always a reason to worry. For example, if your baby is very short and both parents are relatively short, then it may be perfectly appropriate for them to be in the lowest 5 percent.
But if your baby is very short and both parents are average height or taller, or if your baby is very slender and both parents are average weight or larger, then the doctor will make sure that there's no problem with the baby's growth (like a hormone deficiency or genetic problem).
Also, if your baby is in the top 5 percent for weight, the doctor will keep an eye on their growth – and possibly counsel you about their feedings – to make sure they aren't at risk for obesity.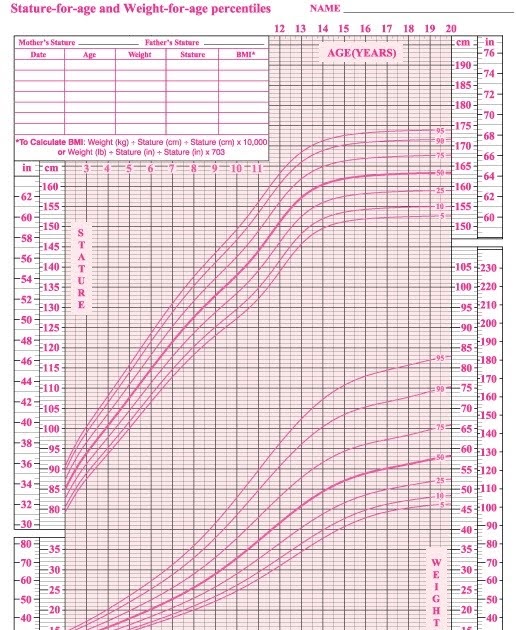
If your baby's head measurement is much smaller than average, the doctor will make sure that their brain is growing and developing normally (a baby's brain growth is reflected in the size of their skull). If your baby's head circumference is much larger than average, they'll be further evaluated to make sure that they don't have excess fluid in the brain, a condition called hydrocephalus.
How much does birth weight determine future growth?
Birth weight seems to matter less than you might think. Genes, not newborn weight, generally determine adult size. Petite babies sometimes grow to be strapping adults, and large babies can become slender over the years.
A baby's parents are the best indicator – are you and your partner tall, short, or average? Slender, heavy, or medium? Chances are, your child will be similarly built as an adult.
Child height predictor: How tall your child will be
girlboy
Child's age
Child's height *
Child's weight *
Mother's height *
Father's height *
Curious to find out how tall your child will be when they grow up? We can't see the future, but with a little math and science, we can make a pretty good guess about how tall they'll be when they're 18 – with a margin of error under 2 inches.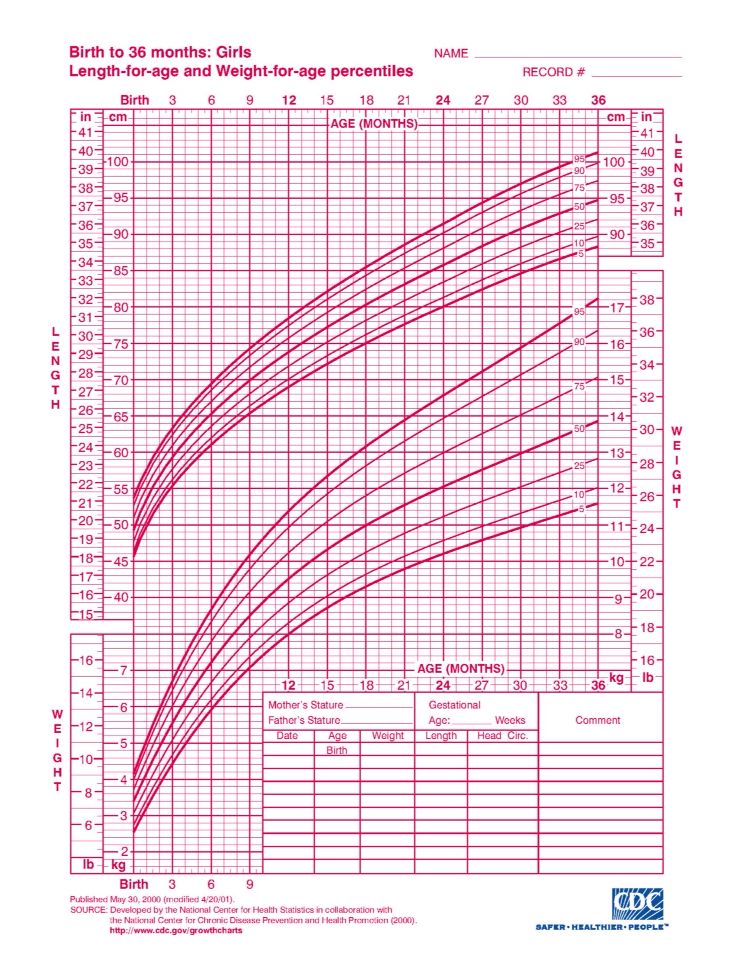
This calculator works for children age 2 and up. (Depending on your child's age, we'll use some or all of the information you entered in our calculations.) You may get inaccurate results for children who are exceptionally tall or are already taller than both their parents.
The Height Predictor is meant to be a fun tool, and doesn't guarantee your child will be this height when they grow up. If you're concerned about your child's growth, talk to their healthcare provider.
How to tell how tall your child will be
There are a few different methods of predicting how tall your child will be when they grow up. Our Child Height Predictor tool uses the Khamis-Roche method, which is based on a study conducted in the 1990s with about 400 participants.
The method takes a child's height, weight, and the average height of their parents, then uses ratios to determine how to calculate the child's predicted height at age 18. A previous method also used the child's skeletal age, which is how mature a child's bones are and requires an X-ray.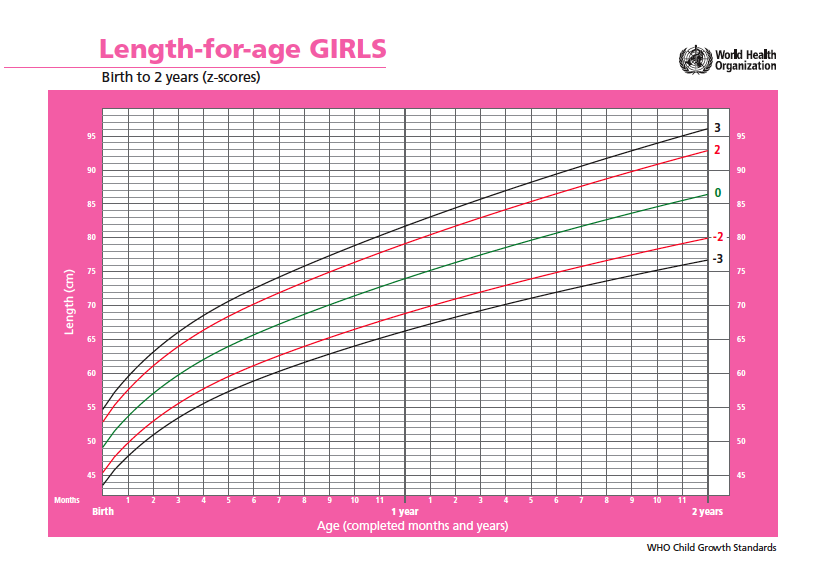 But the Khamis-Roche researchers wanted to find a way parents could predict their child's height without having to get an X-ray taken.
If you want to test out other ways to predict your child's height at home, these are a couple methods you can try:
Two years times two
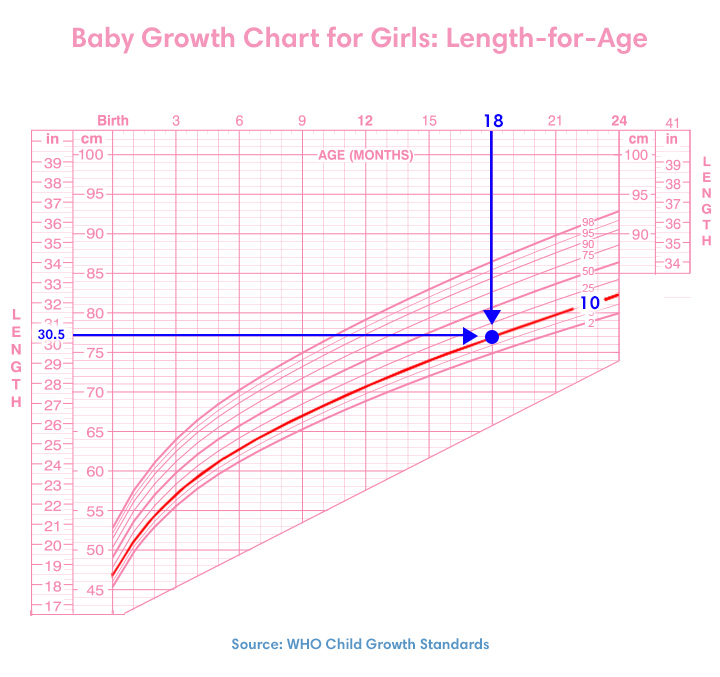
Children grow a ton in their first few years of life – in fact, their first growth spurt from baby to toddler accounts for about half of their adult height. One simple way to predict how tall your child will be when they grow up is to take their height at age 2 if they're a boy or 18 months if they're a girl and double it. (Girls grow a little faster than boys.)
This method has been around for a long time, but there isn't any scientific research about how accurate it is.
Mid-parental method
Another way to estimate your child's adult height is to add together the height of both parents and divide it by two.
Then, some methods say to add 5 inches if they're a boy and subtract 5 inches if they're a girl; others say to only add or subtract 2 ½ inches.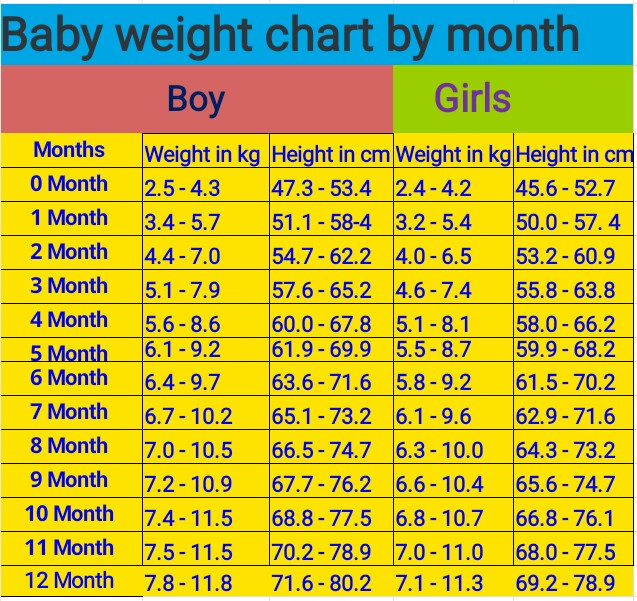 There's a high margin of error with this method – it could be off by 4 inches.
Rebekah Wahlberg
Rebekah Wahlberg is an associate editor at BabyCenter, the world's number one digital parenting resource. She lives in Southern California with her silly dog Booger, where she enjoys hiking, yoga, and watching Netflix when she "should" be reading. Wahlberg is passionate about creating content that helps parents and parents-to-be equip themselves with everything they need to succeed.
Advertisement | page continues below
Tables of weight and height of the child by months and by years. For boys and for girls.
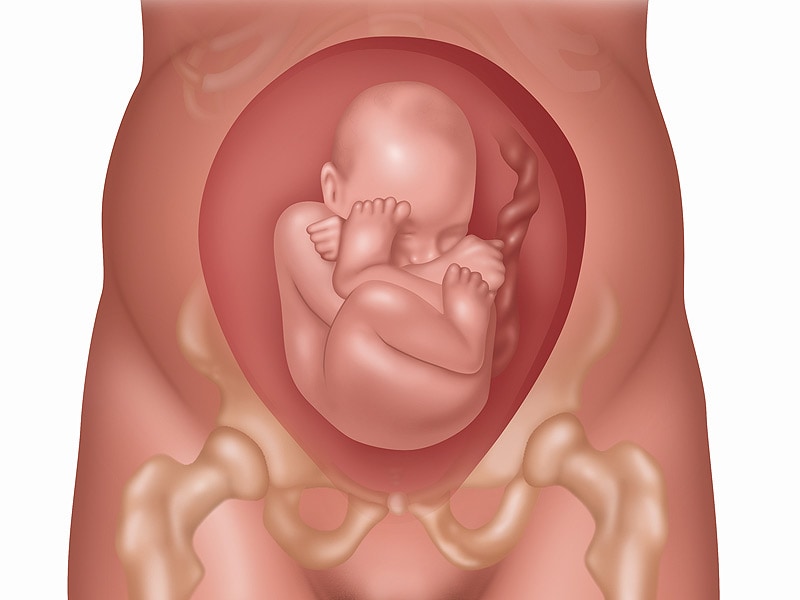
The height and weight of a child are the main indicators of his physical development. That is why immediately after the birth of the baby, it is imperative to measure the weight of his body and the length of the body and continue to weigh himself daily at the same time until discharge from the hospital.
There are many factors that affect the physical development of a child, for example:0010
How to understand what is the norm?
The All-Russian Health Organization recommended special tables for matching the height and weight of children, or as they are called, centile tables. At each examination, the pediatrician measures the height and weight of the child, compares the obtained values \u200b\u200bwith the standard indicators. Such tables allow you to identify obvious pathologies, for a more accurate analysis, the doctor calculates additional indicators using special formulas.
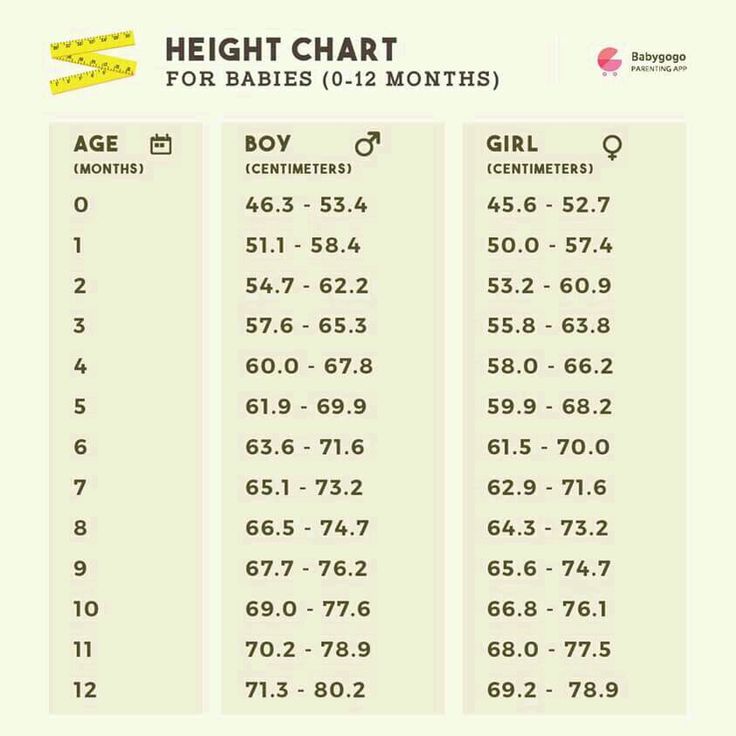
Monthly infant weight and height chart (up to 1 year)
The table shows the average height and weight of infants (under 1 year of age) by month for boys and girls.
| Age | Girls | Boys | ||||||
| , kg | 9000 9000, KG, KG | 9000 9000, KG, KG 9000 9000, KG, KG 9,000|||||||
| Newborns | 3. 33 ± 0.44 33 ± 0.44 | 49.50 ± 1.63 | 3.53 ± 0.45 | 50.43 ± 1.89 | 1 month | 4.15 ± 0.54 | 53.51 ± 2.13 | 4.32 ± 0.64 | 54.53 ± 2.32 |
| 2 months | 5.01 ± 0.56 | 56.95 ± 2.18 | 5 .29 ± 0.76 | 57.71 ± 2.48 | ||||
| 3 months | 6.07 ± 0.58 | 60.29 ± 2.08 903 | 61.30 ± 2.41 | |||||
| 4 months | 6.55 ± 0.79 | 62.15 ± 2.49 | 6.87 ± 0.74 | 63.79 ± 2.68 | ||||
| 9000 3 months | 7.38 ± 0.96 | 63.98 ± 2.49 | 7.82 ± 0.80 | 66.92 ± 1.99 | ||||
| 6 months | 7.97 ± 0.92 | 66.60 ± 2.44 | 8.77 ± 0.78 | 67.995 ± 2.24 80049 7 months | 8.25 ± 0.95 | 67.44 ± 2. 64 64 | 8.92 ± 1.11 | 69.56 ± 2.61 |
| 9000 3 months 9000 | 8.35 ± 1.10 | 69.84 ± 2.07 | 9.46 ± 0.98 | 71.17 ± 2.24 | ||||
| 9000 9 months | 9.28 ± 1 .01 | 70.69 ± 2.21 | 9.89 ± 1.18 | 72.84 ± 2.71 | ||||
| 10 months | 9.52 ± 1.3572.11 ± 2.86 | 10.35 ± 1.12 | 73.91 ± 2.65 | |||||
| 11 months | 9.80 ± 0, 0, 80 | 73.60 ± 2.73 | 10.47 ± 0.98 | 74.90 ± 2.55 | ||||
| 10.04 ± 1.16 | 74.78 ± 2.54 | 10.66 ± 1.21 | 75.78 ± 2.79 | |||||
Table of weight and height of the child by years (from 1 to 18 years)
weight of the child by years aged 1 to 18 years for boys and girls.
| Age | Girls | Boys | |||||
| , kg | 9000 9000, KG, KG | 9000 9000, KG, KG 9000 9000, KG, KG||||||
| 1 year 3 months | 10. 52 ± 1.27 52 ± 1.27 | 76.97 ± 3.00 | 11.40 ± 1.30 | 79.45 ± 3.56 | |||
| 1 year 6 months | 11.40 ± 1.12 | 80.80 ± 2.98 | 11.80 ± 1.18 | 81.73 ± 3.34 | |||
| 9000. 1 year | 12.27 ± 1.37 | 83.75 ± 3.57 | 12.67 ± 1.41 | 84.51 ± 2.85 | |||
| 12.6.63 ± 1.76 | 86.13 ± 3.87 | 13.04 ± 1.23 | 88.27 ± 3.70 | ||||
| 2 years 6 months | 13.93 ± 1.60 | 91.20 ± 4,28 | 13.96 ± 1.27 | 81.85 ± 3.78 | |||
| 3 years old | 14.85 ± 1.53 | 97.27 ± 3 , 78 | 14.95 ± 1.68 | 95.72 ± 3.68 | |||
| 4 years | 16.02 ± 2.30 | 100.56 ± 5.76 | 17, 14 ± 2.18 | 102.44 ± 4.74 | |||
| 5 years | 18.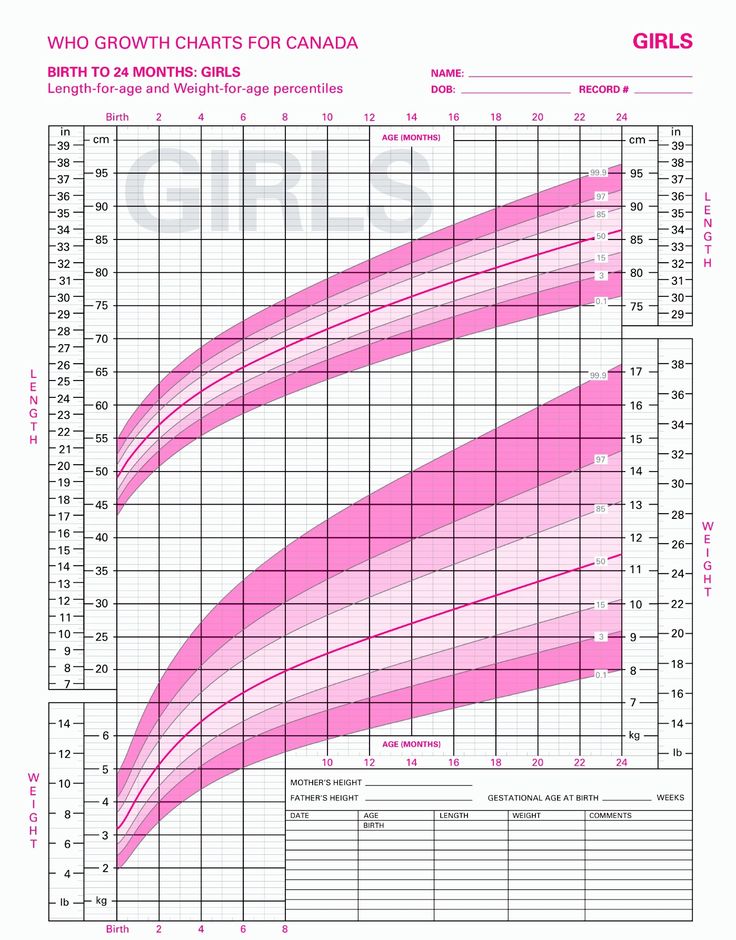 48 ± 2.44 48 ± 2.44 | 109.00 ± 4.72 038 | 110.40 ± 5.14 | | ||||
| 6 years | 21.34 ± 3.14 | 115.70 ± 4.32 | 21.20 | 115.98 ± 5.51 | |||
| 7 years old | 24.66 ± 4.08 | 123.60 ± 5.50 | 24.92 ± 4.44 | 123.88 ± 5.40 | |||
| 8 years | 27.48 ± 4.92 | 129.00 ± 5.48 | 27.86 ± 4.72 | 129.94 ± 5.70 | 0049 9 years old31.02 ± 5,92 | 136.96 ± 6.10 | 30.60 ± 5.86 | 9004.64 ± 6.12
| 10 years 10 years old | 888888888834.32 ± 6.40 | 140.30 ± 6.30 | 33.76 ± 5.26 | 140.33 ± 5.60 | |||
| years 11 years | 37.40 ± 7 06 | 144.58 ± 7.08 | 35.44 ± 6.64 | 143.38 ± 5.72 | |||
| 12 years 9004 038 | 152.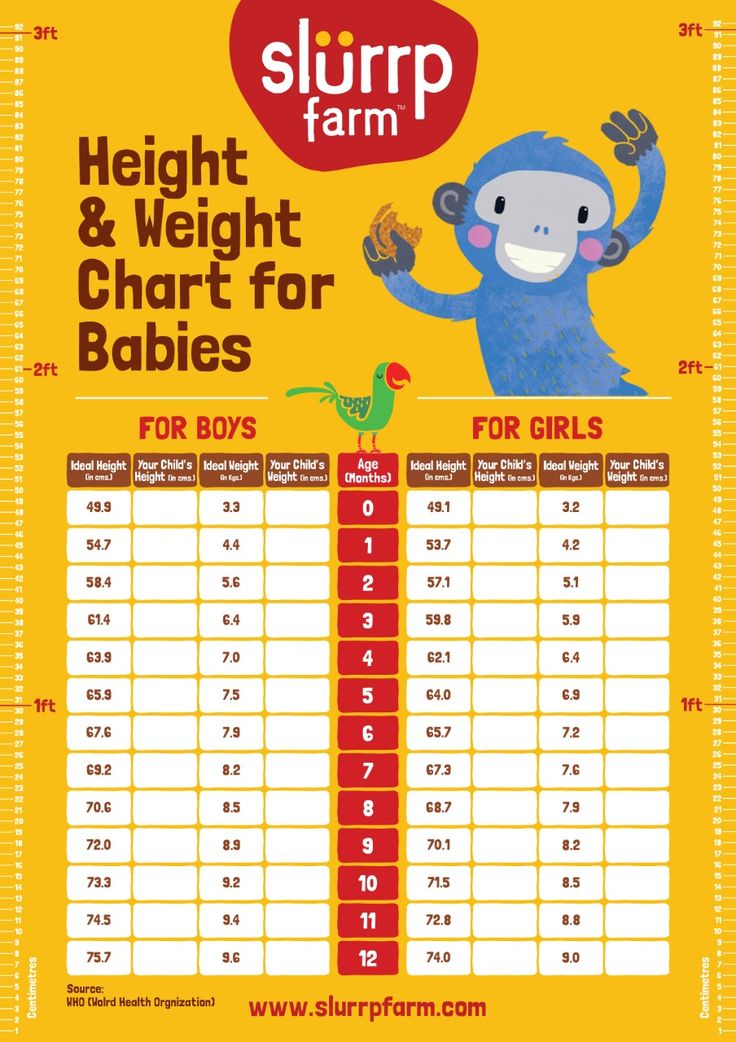 81 ± 7.01 81 ± 7.01 | 41.25 ± 7.40 | 150.05 ± 6.40 | ||||
| 48.70 ± 9.16 | 156.85 ± 6.20 | 45.85 ± 8.26 | 156.65 ± 8.00 | ||||
| 14 years old | 51.32 ± 7.30 | 160.86 ± 6.36 | 51 , 18 ± 7.34 | 162.62 ± 7.34 | |||
| 15 years old | 56.65 ± 9.85 | 161.80 ± 7.40 | 56.50 ± 13.50 ± 13.50 | 168.10 ± 9.50 | |||
| 16 years old | 58.00 ± 9.60 | 162.70 ± 7.50 | 62.40 ± 14.10 | 172.60 ± 9.40 | |||
| 17 years old | 58.60 ± 9.40 | 163.10 ± 7.30 | 67.35 ± 12.75 | 176.30 | |||
Deviations of weight or height from tabular values
There is no need to panic if there is a minimal discrepancy with the indicated values in the table, and here's why:
- First of all, the child's height and weight charts contain reference indicators , what should ideally be the weight and height of the child, without taking into account many other factors .
 Sometimes parents of premature babies mistakenly use a standard table for comparison, while there are special tables for assessing the development of children born prematurely.
 - The rate of growth and weight gain for each child is unique . In the first year of life, babies develop in leaps and bounds. For example, during the period of introducing complementary foods, the weight of the baby may not reach the “norm” due to adaptation to a new type of food, and not because of pathology.
This does not mean that deviations from the norm should be ignored , but it is better to regard them as an occasion to pay attention and consult a specialist in order to identify possible health problems, or to make sure that they are not present.
What can cause obvious deviations from the norm?
Earlier we talked about minor deviations from the norm and that there is no need to be scared if your child is not growing and gaining weight strictly according to the chart.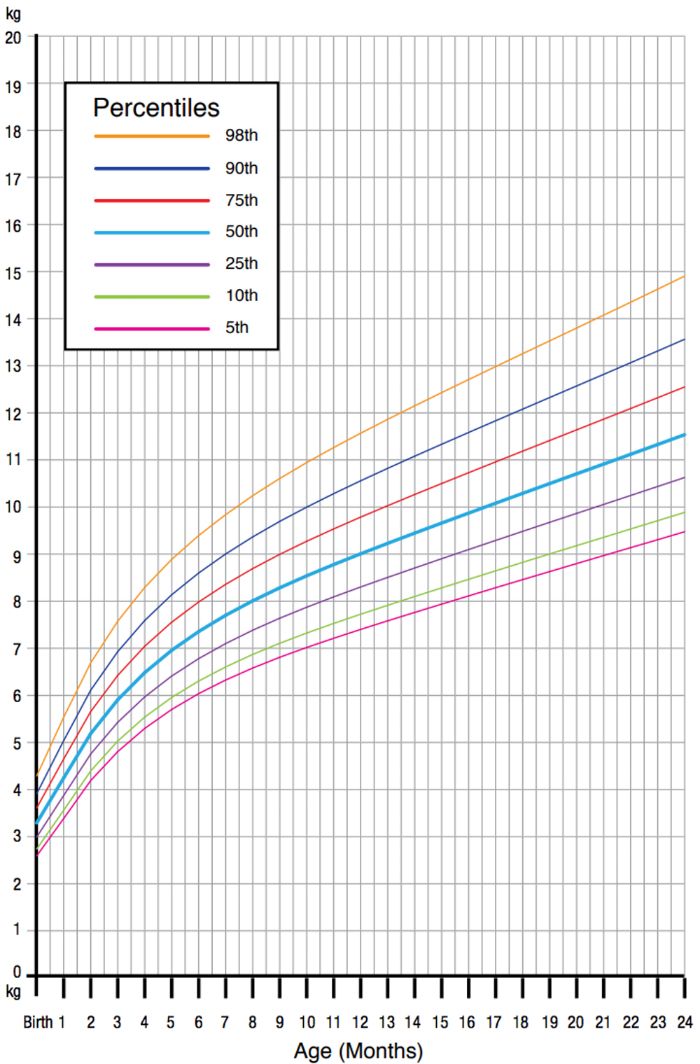 But what to do if the values of the essential have gone beyond the limits of the permissible parameters , or are they at the intersection of norm and pathology?
Reasons for possible deviations can be divided into two groups:
1. Non-endocrine:
- Constitutional growth retardation . Or in another way, the syndrome of late puberty. One of the variants of the norm, when the puberty jump occurs later than in other children.
- Family stunting . It has a hereditary predisposition, in the family of such children there are relatives with short stature. Growth retardation manifests itself from early childhood.
- Prematurity, intrauterine and postnatal injuries.
- Genetic syndromes . As a rule, they have many clinical manifestations, one of which is growth retardation.
- Chronic diseases of the cardiovascular, bronchopulmonary systems, gastrointestinal tract, as well as anemia.
- Fasting .
- Taking certain medications .
2. Endocrine:
- Growth hormone deficiency . Biologically active substance, which is the main regulator of the growth process after 2 years.
- Deficiency of thyroid hormones . More often of a congenital nature, it is clinically characterized by a delay in physical and intellectual development from birth.
- Type 1 diabetes mellitus . A disease in which, due to insulin deficiency, the flow of glucose into the cells of the body is impaired, the so-called. "starvation" of cells, as a result, growth rates slow down.
- Itsenko-Cushing's disease (or syndrome) . At the same time, the production of hormones of the adrenal cortex, glucocorticoids, is increased, which in large doses leads to a violation of the secretion of growth hormone.
- Rickets .
 A lack of vitamin D leads to bone destruction and skeletal deformities, which in turn is manifested, among other things, by a decrease in growth.
 - Other rare disorders of the endocrine system.
As you can see, there are a lot of reasons.
If the child's growth is stunted, parents should consult a doctor to identify the causes of short stature and correct it in a timely manner.
Which specialist should I contact? First, you should make an appointment with a pediatrician. Also, in most cases, consultation with a pediatric endocrinologist is required.
Remember that for the normal growth of the child you need a complete, balanced diet with enough vitamins and minerals, as well as dosed physical activity.
Chart 0-16 years old
The weight and height chart for girls is a set of data on the two main physiological indicators of body development. Based on this data, parents and pediatricians can assess how well and harmoniously the child develops, and timely correct emerging deviations, if necessary.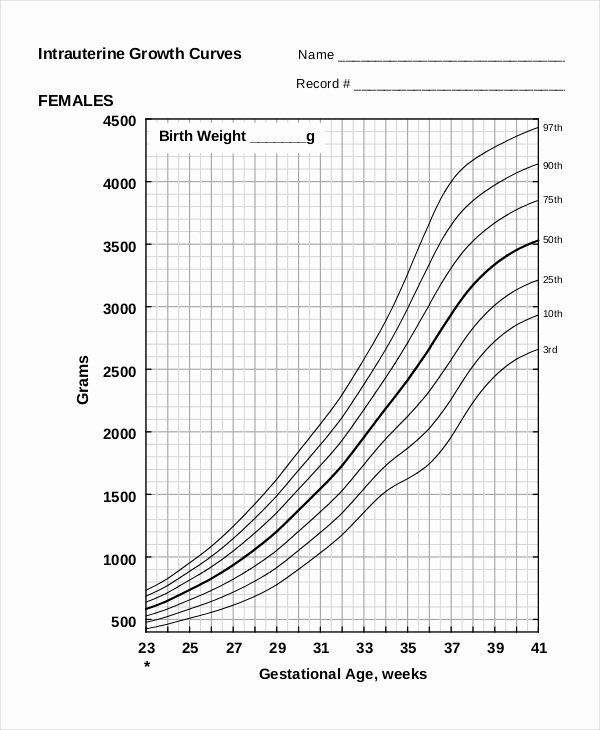
Infants 0 to 1
Infants are monitored closely. Physiological data is needed not only to buy clothes and diapers for the little princess in size. If they do not correspond to the established ones, you should look for the cause of the violation in order to correct the development of the baby in time.
Weight table for babies (in kg):
| Age, month | Insufficient | Low | Lower limit | Norm | Upper limit | High | Very high |
|---|---|---|---|---|---|---|---|
| At birth | 2.0-2.4 | 2.4-2.8 | 2.8 | 3.2 | 3.7 | 3.7-4.2 | 4.2-4.8 |
| 1 | 2.7-3.2 | 3.2-3.6 | 3.6 | 4.2 | 4.8 | 4.8-5.5 | 5.5-6.2 |
| 2 | 3.5-3.9 | 3.9-4.5 | 4.5 | 5. 1 1 | 5.8 | 5.8-6.6 | 6.6-7.5 |
| 3 | 4.0-4.5 | 4.5-5.2 | 5.2 | 5.9 | 6.6 | 6.6-7.5 | 7.5-8.5 |
| 4 | 4.4-5.0 | 5.0-5.7 | 5.7 | 6.4 | 7.3 | 7.3-8.2 | 8.2-9.3 |
| 5 | 4.8-5.4 | 5.4-6.1 | 6.1 | 6.9 | 7.8 | 7.8-8.8 | 8.8-10.0 |
| 6 | 5.1-5.7 | 5.7-6.5 | 6.5 | 7.3 | 8.3 | 8.3-9.4 | 9.4-10.6 |
| 7 | 5.3-6.0 | 6.0-6.8 | 6.8 | 7.6 | 8.6 | 8.6-9.8 | 9.8-11.1 |
| 8 | 5.6-6.2 | 6.2-7.0 | 7 | 8 | 9 | 9.0-10.2 | 10.2-11.6 |
| 9 | 5.8-6.5 | 6.5-7.3 | 7.3 | 8.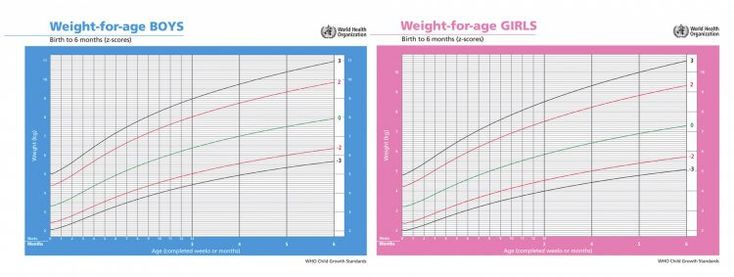 2 2 | 9.3 | 9.3-10.6 | 10.6-12.0 |
| 10 | 5.9-6.7 | 6.7-7.5 | 7.5 | 8.5 | 9.6 | 9.6-10.9 | 10.9-12.4 |
| 11 | 6.1-6.9 | 6.9-7.7 | 7.7 | 8.7 | 9.9 | 9.9-11.2 | 11.2-12.8 |
| 12 | 6.3-7.0 | 7.0-7.9 | 7.9 | 8.9 | 10.1 | 10.1-11.5 | 11.5-13.1 |
In a similar form, a table of height of children by age (girls) (in cm) is compiled:0690
 8-51.7
 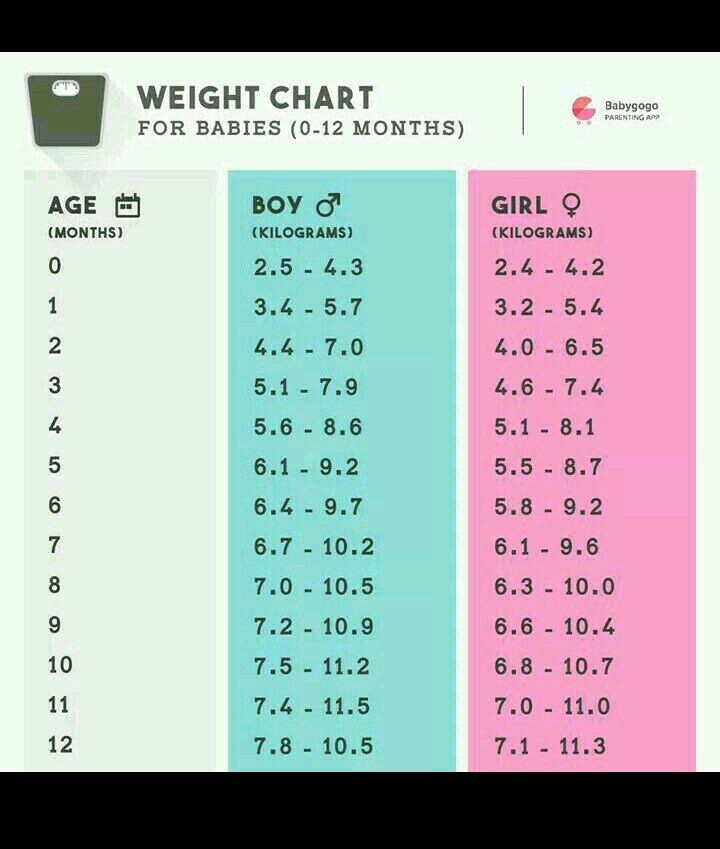 9-74.2
 Indicators are formed on the basis of average statistics, including indicators for children born with a small, average or high value. The average level is ideal for most children.
Children from 1 to 3 years old
During this period, the child is actively developing, the skeleton is being formed, and the charming “puffiness” is gradually smoothed out.
Normal growth of a child by years in the table for girls (in cm):
The data are considered in aggregate: with normal development, the norms of height and weight for girls are in the same category (if one indicator is above ideal, then the other is in the interval above).
Weight of girls from one to three years (in kg):
| Age | Insufficient | Low | Lower limit | Norm | Upper limit | High | Very high |
|---|---|---|---|---|---|---|---|
| 1 | 6.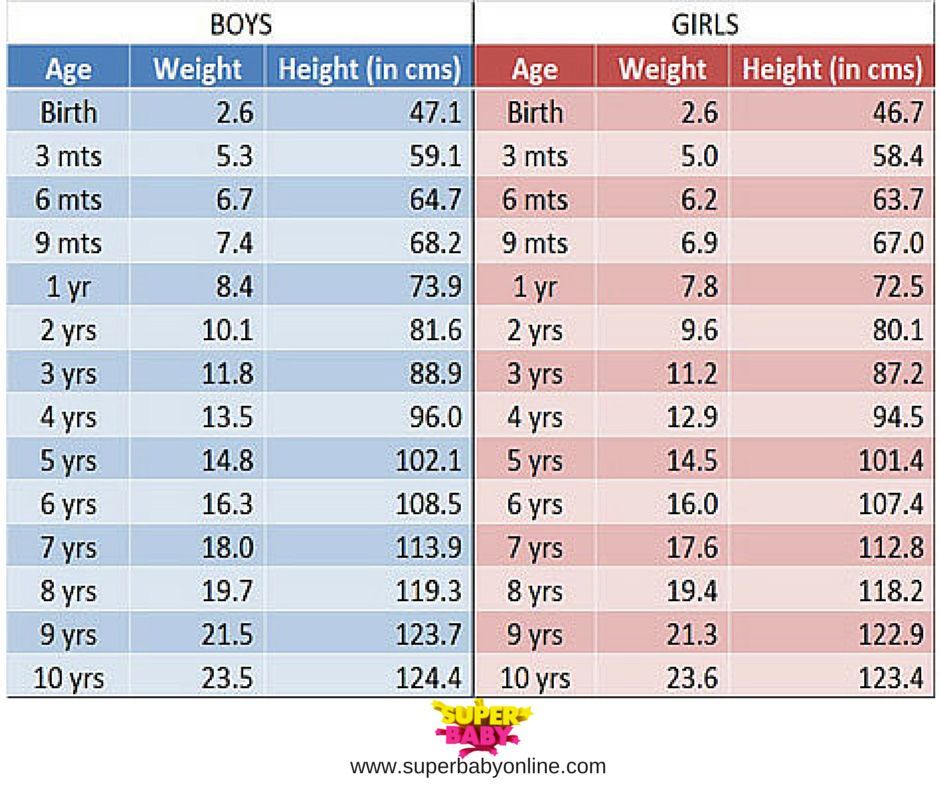 3-7.0 3-7.0 | 7.0-7.9 | 7.9 | 8.9 | 10.1 | 10.1-11.5 | 11.5-13.1 |
| 2 | 8.1-9.0 | 9.0-10.2 | 10.2 | 11.5 | 13 | 13.0-14.8 | 14.8-17.0 |
| 3 | 9.6-10.8 | 10.8-12.2 | 12.2 | 13.9 | 15.8 | 15.8-18.1 | 18.1-20.9 |
Pediatricians and parents use the child's weight table by years for girls to evaluate not only each individual indicator, but, most importantly, their correspondence to each other. So, if a girl's height at 2 years old is 80 cm, with normal development, her weight will not exceed 10.2 kg.
| Indicators | Insufficient | Low | Lower limit | Norm | Upper limit | High | Very high |
|---|---|---|---|---|---|---|---|
| Body length | 76.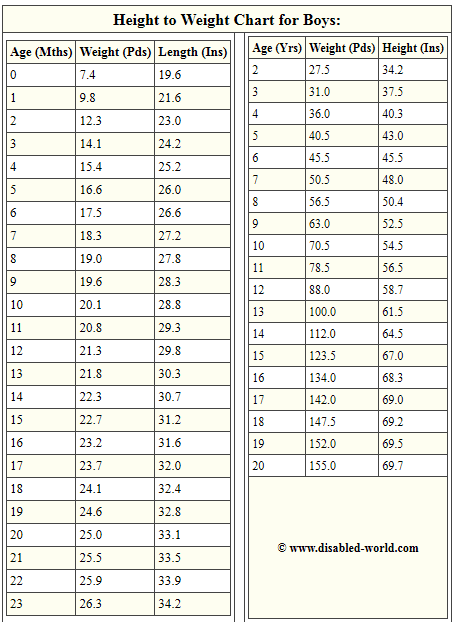 7-80.0 7-80.0 | 80.0-83.2 | 83.2 | 86.4 | 89.6 | 89.6-92.9 | 92.9-96.1 |
| Body weight | 8.1-9.0 | 9.0-10.2 | 10.2 | 11.5 | 13 | 13.0-14.8 | 14.8-17.0 |
Similarly, if the height of a girl at 3 years old is, for example, 100 cm, her weight, ideally, lies in the range of 15.8-18.1 kg.
| Indicators | Insufficient | Low | Lower limit | Norm | Upper limit | High | Very high |
|---|---|---|---|---|---|---|---|
| Body length | 83.6-87.4 | 87.4-91.2 | 91.2 | 95.1 | 98.9 | 98.9-102.7 | 102.7-106.5 |
| Body weight | 9.6-10.8 | 10.8-12.2 | 12.2 | 13.9 | 15.8 | 15.8-18.1 | 18.1-20.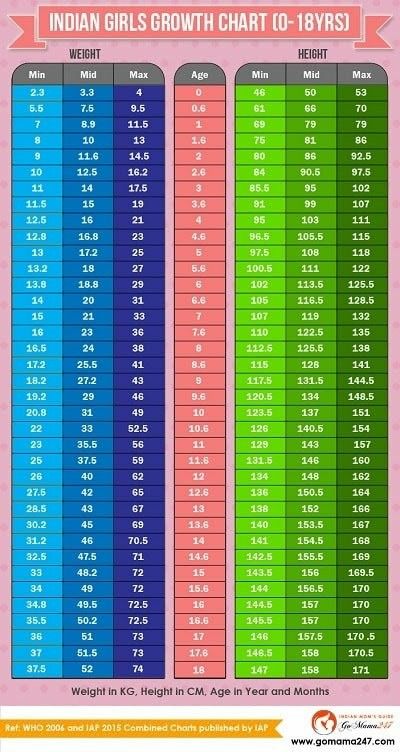 9 9 |
Children under 10
This data is used in kindergartens and schools, for scheduled medical examinations. If there are deviations, health workers give recommendations to parents on nutrition or give a referral for an additional examination.
Body length of girls under 10 (in cm):
| Age, years | Insufficient | Low | Lower limit | Norm | Upper limit | High | Very high |
|---|---|---|---|---|---|---|---|
| 3 | 83.6-87.4 | 87.4-91.2 | 91.2 | 95.1 | 98.9 | 98.9-102.7 | 102.7-106.5 |
| 4 | 89.8-94.1 | 94.1-98.4 | 98.4 | 102.7 | 107 | 107.0-111.3 | 111.3-115.7 |
| 5 | 95.2-99.9 | 99.9-104.7 | 104.7 | 109.4 | 114. 2 2 | 114.2-118.9 | 118.9-123.7 |
| 6 | 99.8-104.9 | 104.9-110.0 | 110 | 115.1 | 120.2 | 120.2-125.4 | 125.4-130.5 |
| 7 | 104.4-109.9 | 109.9-115.3 | 115.3 | 120.8 | 126.3 | 126.3-131.7 | 131.7-137.2 |
| 8 | 109.2-115.0 | 115.0-120.8 | 120.8 | 126.6 | 132.4 | 132.4-138.2 | 138.2-143.9 |
| 9 | 114.2-120.3 | 120.3-126.4 | 126.4 | 132.5 | 138.6 | 138.6-144.7 | 144.7-150.8 |
| 10 | 119.4-125.8 | 125.8-132.2 | 132.2 | 138.6 | 145 | 145.0-151.4 | 151.4-157.8 |
Height and weight are based on research and statistics and are subject to WHO approval. These data are reviewed periodically.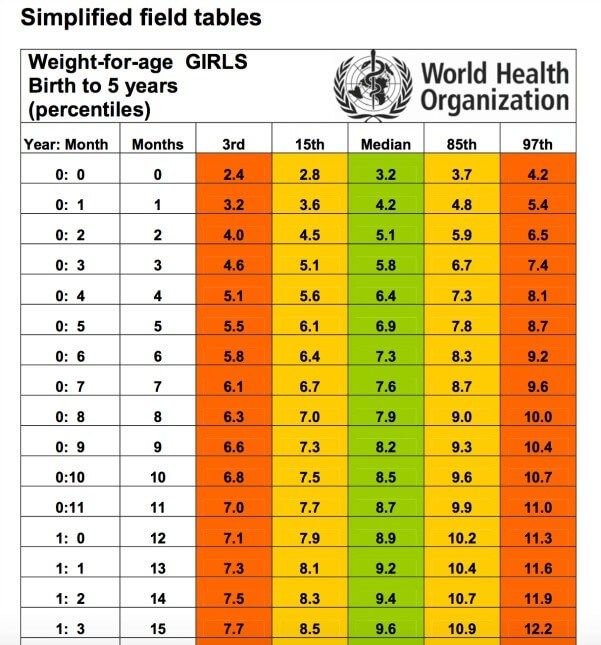 If your child's data does not fall within the lower or upper limits, there may not be any cause for concern. If the tests are in order, the child is in good health and there are no visible abnormalities, do not worry. No one has canceled the influence of genetics, the developmental characteristics of a particular child.
Weight of child under 10 (in kg):
| Age | Insufficient | Low | Lower limit | Norm | Upper limit | High | Very high |
|---|---|---|---|---|---|---|---|
| 3 | 9.6-10.8 | 10.8-12.2 | 12.2 | 13.9 | 15.8 | 15.8-18.1 | 18.1-20.9 |
| 4 | 10.9-12.3 | 12.3-14.0 | 14 | 16.1 | 18.5 | 18.5-21.5 | 21.5-25.2 |
| 5 | 12.1-13.7 | 13.7-15.8 | 15.8 | 18.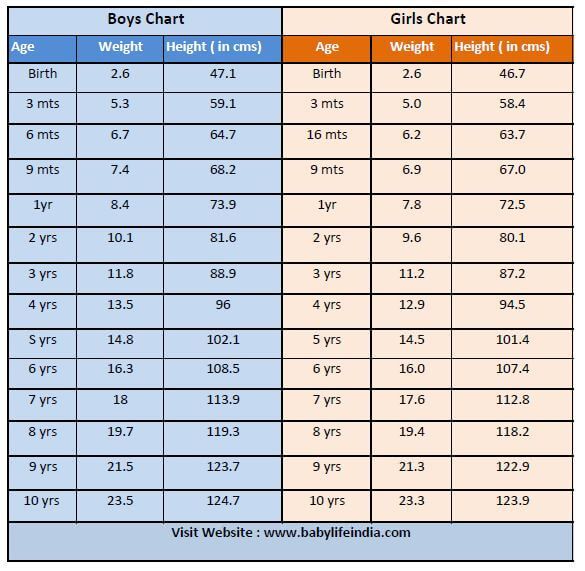 2 2 | 21.2 | 21.2-24.9 | 24.9-29.5 |
| 6 | 13.5-15.3 | 15.3-17.5 | 17.5 | 20.2 | 23.5 | 23.5-27.8 | 27.8-33.4 |
| 7 | 14.8-16.8 | 16.8-19.3 | 19.3 | 22.4 | 26.3 | 26.3-31.4 | 31.4-38.3 |
| 8 | 16.3-18.6 | 18.6-21.4 | 21.4 | 25 | 29.7 | 29.7-35.8 | 35.8-44.1 |
| 9 | 18.1-20.8 | 20.8-24.0 | 24 | 28.2 | 33.6 | 33.6-41.0 | 41.0-51.1 |
| 10 | 20.3-23.3 | 23.3-27.0 | 27 | 31.9 | 38.2 | 38.2-46.9 | 46.9-59.2 |
Pay attention to the consistency of the data.
For example, if a girl of 8 years old is 139 cm tall and weighs 25 kg, this is very small, a weight of 35.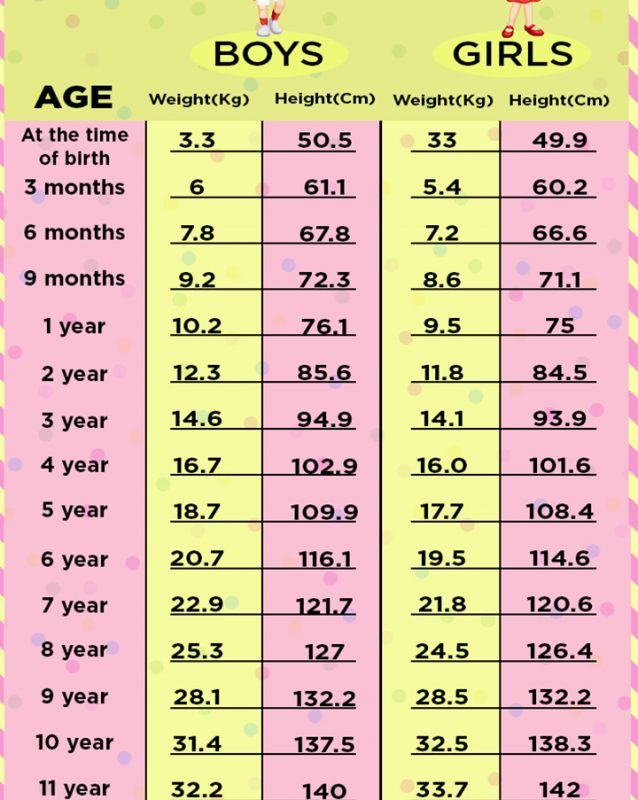 8 kg is sufficient.
| Indicators | Insufficient | Low | Lower limit | Norm | Upper limit | High | Very high |
|---|---|---|---|---|---|---|---|
| Body length | 109.2-115.0 | 115.0-120.8 | 120.8 | 126.6 | 132.4 | 132.4-138.2 | 138.2-143.9 |
| Body weight | 16.3-18.6 | 18.6-21.4 | 21.4 | 25 | 29.7 | 29.7-35.8 | 35.8-44.1 |
Similarly, if a girl at 5 years old is 96 cm and weighs 21 kg, this is not good, but for taller children of the same age, this weight is normal.
| Indicators | Insufficient | Low | Lower limit | Norm | Upper limit | High | Very high |
|---|---|---|---|---|---|---|---|
| Body length | 95.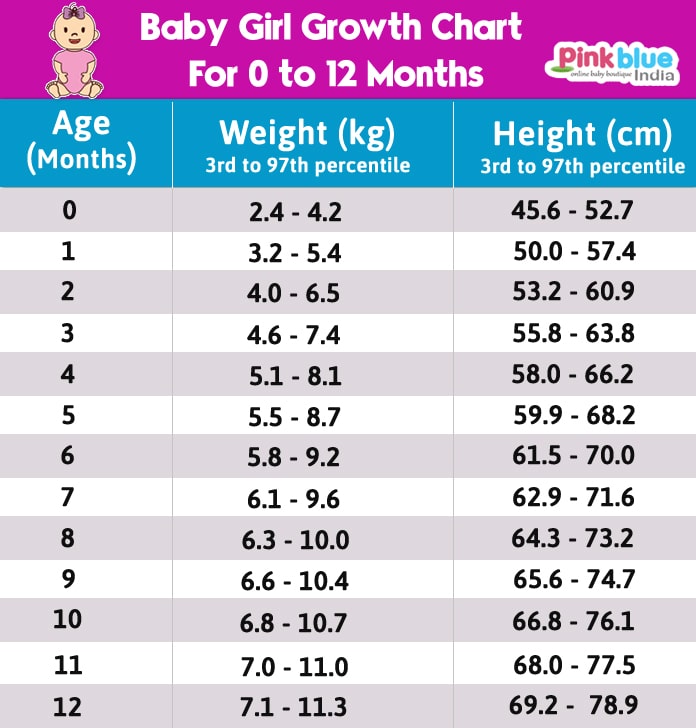 2-99.9 2-99.9 | 99.9-104.7 | 104.7 | 109.4 | 114.2 | 114.2-118.9 | 118.9-123.7 |
| Body weight | 12.1-13.7 | 13.7-15.8 | 15.8 | 18.2 | 21.2 | 21.2-24.9 | 24.9-29.5 |
Adolescents under 16
Height from 11 to 16 (in cm):
| Small | Normal | High | |
|---|---|---|---|
| 11 | 136.2-153.2 | >153.2 | |
| 12 | 142.2-159.2 | >159.2 | |
| 13 | 148.3-163.7 | >163.7 | |
| 14 | 152.6-167.2 | >167.2 | |
| 15 | 154.4-169.2 | >169.2 | |
| 16 | 155.2-170.2 | >170.2 |
At this age, the child's body quickly matures, develops and transforms. It is important to remember that the increase in indicators is normal, if not too rapid. Their too rapid increase often leads to problems with the musculoskeletal system, hormonal and other systems. If the child is changing very quickly, consult a doctor for a more professional control of the condition of the body.
Weight from 11 to 16 (in kg):
| Age, year | Small | Normal | High |
|---|---|---|---|
| 11 | 27.8-44.6 | >44.6 | |
| 12 | 31.8-51.8 | >51.8 | |
| 13 | 38.7-59.0 | >59.0 | |
| 14 | 43.8-64.0 | >64.0 | |
| 15 | 46.8-66.5 | >66.5 | |
| 16 | 48.4-67.6 | >67.6 |
For example, in a teenager at 14, with a weight of 40 kg and a height of 168 cm, exhaustion is observed.