Infant growth chart who
Weight For Age WHO 0-2 Year
English | 中文版
Weight Age 0-2 Length Age 0-2 Weight Length 0-2 Head Circum 0-2
Was this useful to you? Help others and share.
Description:
Note, the CDC recommends the use of the WHO charts for babies and infants from birth to two years of age. This app uses WHO tables and data for calculations.
This calculator provides your baby's weight percentile based on age. The percentile shows how your infant's weight compares to other infants. The percentile tells you what percentage of babies weigh less than your baby. For example out of a sample of 100 babies, a percentile value of 40 percent means your baby weighs more than 40 babies and weighs less than the other 60 babies.
A percentile of 50% represents the average or mean weight. A value below 50 percent means a baby weighs less than the average. A value greater than 50 percent means a baby is above average. This does not mean your baby is overweight or underweight. A doctor or physician should be consulted to determine weight status.
Calculation Instructions:
- Note, this calculator uses the World Health Organization (WHO) infant charts for 0-2 year olds
- Enter Birthday
- Enter Measurement Date
- Enter Weight
Outputs:
- Percentile - The weight percentile of the child.
- Age - The age of the child in months
- Weight - The mass of the child in metric and standard units.
- Graph Plot - Weight versus age graph with 5, 10, 25, 50, 75, 95 and calculated percentile lines.
Reference:
"The WHO Child Growth Standards". The World Health Organization. https://www.who.int/toolkits/child-growth-standards/standards.
Child Height Predictor:
Child Height Predictor - Predict Adult Height
CDC Recommended Growth Charts:
The United States Center for Disease Control (CDC) recommends using the World Health Organization (WHO) charts for the first two year of life (0 to 2 years). After two years, it is recommended to return to the CDC charts.
Weight-Age (WHO 0-2 years) Length-Age (WHO 0-2 years) Weight-Length (WHO 0-2 years) Head Circumference-Age (WHO 0-2 years)
Weight-Age (CDC 2-20 Years) Stature-Age (CDC 2-20 Years) Weight-Stature (CDC 2-20 Years)
CDC Growth Charts:
Weight-Age (CDC 0-3 years) Length-Age (CDC 0-3 years) Weight-Length (CDC 0-3 years) Head Circumference-Age (CDC 0-3 years) Weight-Age (CDC 2-20 Years) Stature-Age (CDC 2-20 Years) Weight-Stature (CDC 2-20 Years)
WHO Growth Charts:
Weight-Age (WHO 0-5 years) Length-Age (WHO 0-2 years) Height-Age (WHO 2-5 years) Weight-Length (WHO 0-2 years) Weight-Height (WHO 2-5 years) Head Circumference-Age (WHO 0-5 years)
Chinese Growth Charts:
Weight-Age (China 0-18 years) Length-Age (China 0-3 years) Height-Age (China 3-18 years) Head Circumference-Age (China 0-6 years) Weight-Length (China 0-3 years) Weight-Height (China 3-18 years)
Preterm Infant Growth Charts:
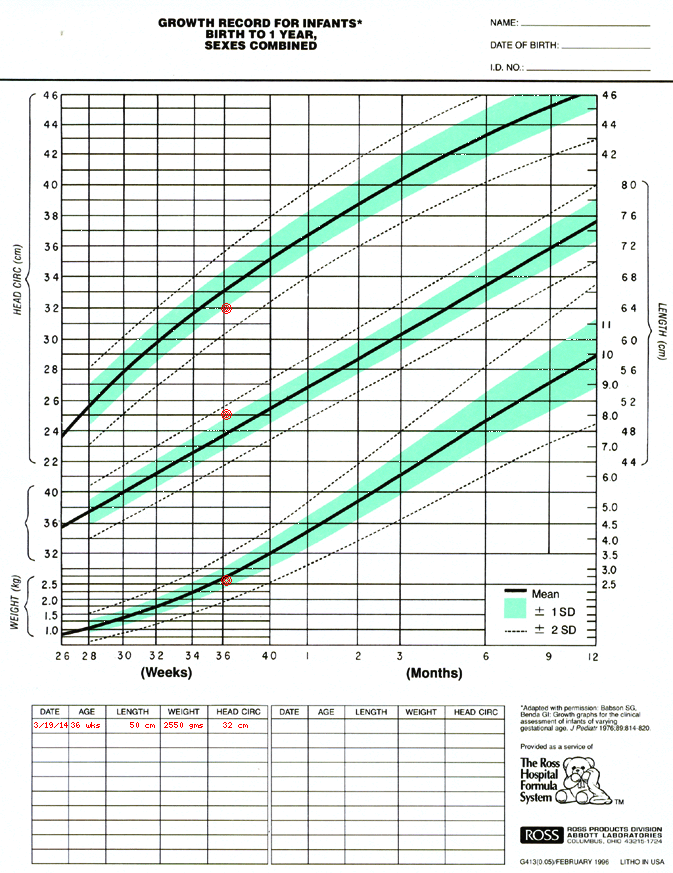
Weight-Age (23-41 Gestational Weeks) Length-Age (23-41 Gestational Weeks) Head Circumference-Age (23-41 Gestational)
Email Contact and Privacy Policy:
Contact: aj@ajdesigner. com
Privacy Policy - Legal Disclaimer
Popular Pages:
Sale Discount Calculator - Percent Off Loan Calculator Mortgage Extra Payment Paycheck Overtime Rate Calculator Jobs Salary Pay Check Converter Temperature Converter Fraction Calculator - Simplify Reduce Engine Motor Horsepower Calculator Earned Value Project Management Present Worth Calculator - Finance Constant Acceleration Motion Physics Statistics Equations Formulas Mortgage Loan Calculator - Finance Weight Loss Diet Calculator Body Mass Index BMI Calculator Light Bulb Energy Cost Analysis Automobile Fuel Economy - Gasoline Tire Size Comparison Calculator Water Pump Calculator - Hydraulics Geometry Square Circle Cylinder Triangle Calculator Torque Calculator Density Calculator Pressure Calculator Power Calculator Force Calculator
Disclaimer:
Use this calculator at your own risk. This calculator may or may not be accurate or reliable. By using this calculator you acknowledge any reliance on this calculator shall be at your sole risk.
AJ Design Software:
Technical Tools, Specifications, How to Guides, Training, Applications, Examples, Tutorials, Reviews, Answers, Test Review Resources, Analysis, Homework Solutions, Help, Data and Information for Engineers, Technicians, Teachers, Tutors, Researchers, K-12 Education, College and High School Students, Science Fair Projects and Scientists
Weight Age WHO 0-5 Year
Weight Age 0-5 Height Age 2-5 Weight Height 2-5 Head Circum 0-5
Was this useful to you? Help others and share.
Description:
This app uses WHO tables and data for weight for age calculations. The calculator is valid for babies, infants, toddlers and preschoolers with an age range of birth to five years.
This calculator provides your child's weight percentile based on age.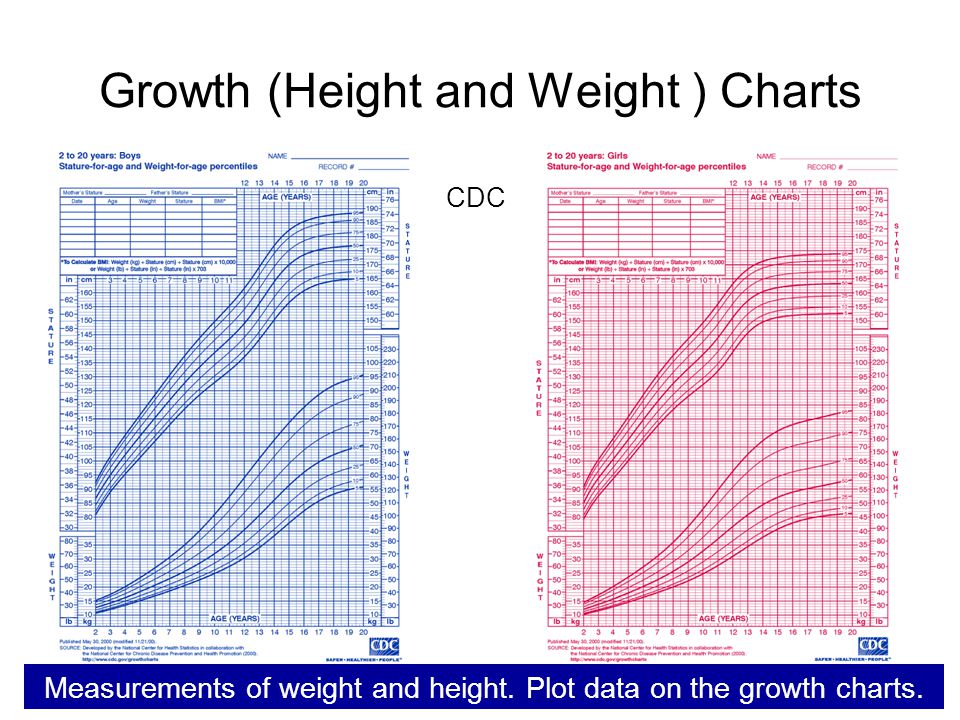 The percentile shows how your child's weight compares to other children. The percentile tells you what percentage of babies weigh less than your child. For example out of a sample of 100 babies, a percentile value of 40 percent means your child weighs more than 40 babies and weighs less than the other 60 babies.
A percentile of 50% represents the average or mean weight. A value below 50 percent means a child weighs less than the average. A value greater than 50 percent means a child is above average. This does not mean your child is overweight or underweight. A doctor or physician should be consulted to determine weight status.
Calculation Instructions:
- Select Gender - Choose male for boys and female for girls.
- Enter Birthday - Day of birth
- Enter Measurement Date - Enter the day the measurement was taken.
- Enter Weight - The mass of child
- Select Units
-
- kg - Metric kilogram
- lb - Standard US pound
Outputs:
- Percentile - The weight percentile of the child.
- Age - The age of the child in months
- Weight - The mass of the child in metric and standard units.
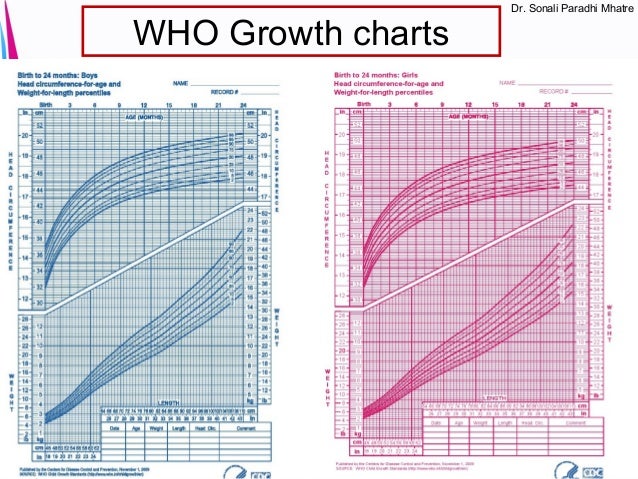
- Graph Plot - Weight versus age graph with 5, 10, 25, 50, 75, 95 and calculated percentile lines.
Reference:
"The WHO Child Growth Standards". The World Health Organization. https://www.who.int/toolkits/child-growth-standards/standards.
Child Height Predictor:
Child Height Predictor - Predict Adult Height
CDC Recommended Growth Charts:
The United States Center for Disease Control (CDC) recommends using the World Health Organization (WHO) charts for the first two year of life (0 to 2 years). After two years, it is recommended to return to the CDC charts.
Weight-Age (WHO 0-2 years) Length-Age (WHO 0-2 years) Weight-Length (WHO 0-2 years) Head Circumference-Age (WHO 0-2 years)
Weight-Age (CDC 2-20 Years) Stature-Age (CDC 2-20 Years) Weight-Stature (CDC 2-20 Years)
CDC Growth Charts:
Weight-Age (CDC 0-3 years) Length-Age (CDC 0-3 years) Weight-Length (CDC 0-3 years) Head Circumference-Age (CDC 0-3 years) Weight-Age (CDC 2-20 Years) Stature-Age (CDC 2-20 Years) Weight-Stature (CDC 2-20 Years)
WHO Growth Charts:
Weight-Age (WHO 0-5 years) Length-Age (WHO 0-2 years) Height-Age (WHO 2-5 years) Weight-Length (WHO 0-2 years) Weight-Height (WHO 2-5 years) Head Circumference-Age (WHO 0-5 years)
Chinese Growth Charts:
Weight-Age (China 0-18 years) Length-Age (China 0-3 years) Height-Age (China 3-18 years) Head Circumference-Age (China 0-6 years) Weight-Length (China 0-3 years) Weight-Height (China 3-18 years)
Preterm Infant Growth Charts:
Weight-Age (23-41 Gestational Weeks) Length-Age (23-41 Gestational Weeks) Head Circumference-Age (23-41 Gestational)
Email Contact and Privacy Policy:
Contact: aj@ajdesigner. com
Privacy Policy - Legal Disclaimer
Popular Pages:
Sale Discount Calculator - Percent Off Loan Calculator Mortgage Extra Payment Paycheck Overtime Rate Calculator Jobs Salary Pay Check Converter Temperature Converter Fraction Calculator - Simplify Reduce Engine Motor Horsepower Calculator Earned Value Project Management Present Worth Calculator - Finance Constant Acceleration Motion Physics Statistics Equations Formulas Mortgage Loan Calculator - Finance Weight Loss Diet Calculator Body Mass Index BMI Calculator Light Bulb Energy Cost Analysis Automobile Fuel Economy - Gasoline Tire Size Comparison Calculator Water Pump Calculator - Hydraulics Geometry Square Circle Cylinder Triangle Calculator Torque Calculator Density Calculator Pressure Calculator Power Calculator Force Calculator
Disclaimer:
Use this calculator at your own risk.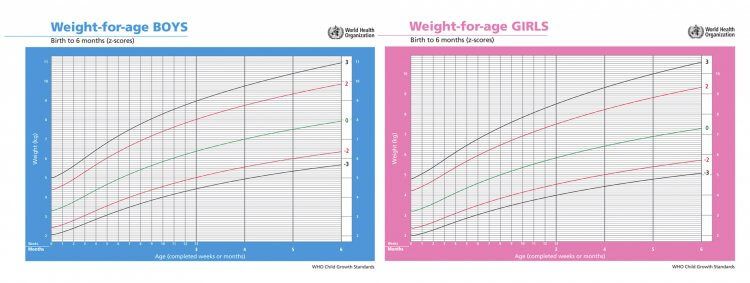 This calculator may or may not be accurate or reliable. By using this calculator you acknowledge any reliance on this calculator shall be at your sole risk.
AJ Design Software:
Technical Tools, Specifications, How to Guides, Training, Applications, Examples, Tutorials, Reviews, Answers, Test Review Resources, Analysis, Homework Solutions, Help, Data and Information for Engineers, Technicians, Teachers, Tutors, Researchers, K-12 Education, College and High School Students, Science Fair Projects and Scientists
Tables of weight and height of the child by months and by years. For boys and for girls.
The height and weight of a child are the main indicators of his physical development. That is why immediately after the birth of the baby, it is imperative to measure the weight of his body and the length of the body and continue to weigh himself daily at the same time until discharge from the hospital.
There are many factors that affect the physical development of a child, for example:0010
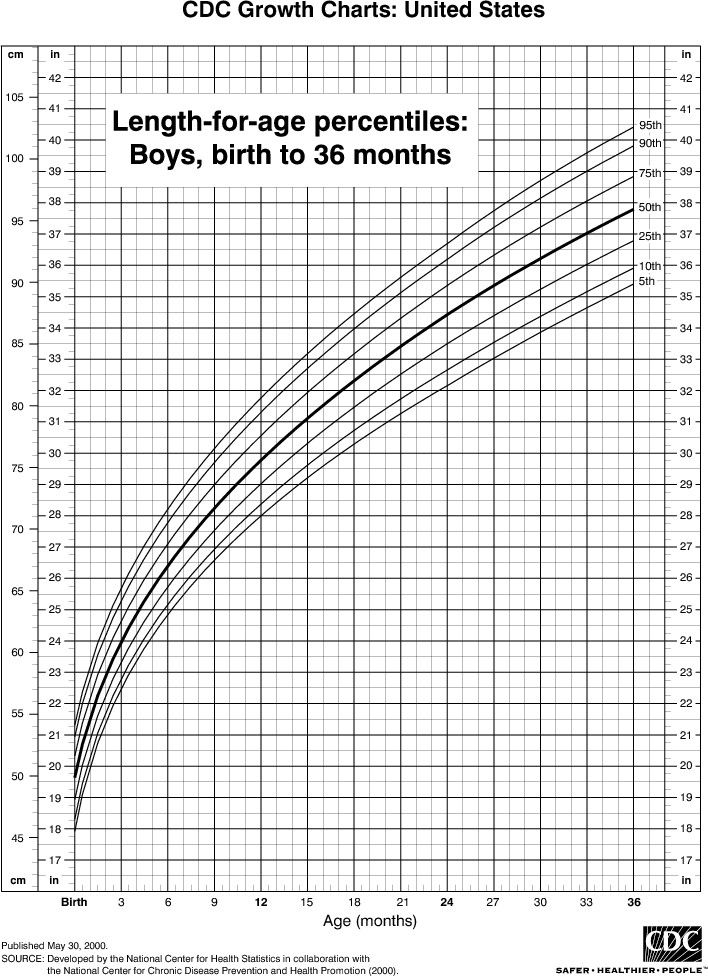
How to understand what is the norm?
The All-Russian Health Organization recommended special tables for matching the height and weight of children, or as they are called, centile tables. At each examination, the pediatrician measures the height and weight of the child, compares the obtained values \u200b\u200bwith the standard indicators. Such tables allow you to identify obvious pathologies, for a more accurate analysis, the doctor calculates additional indicators using special formulas.
Monthly infant weight and height chart (up to 1 year)
The table shows the average height and weight of infants (under 1 year of age) by month for boys and girls.
| Age | Girls | Boys | ||||||
| , kg | 9000 9000, KG, KG | 9000 9000, KG, KG 9000 9000, KG, KG 9,000|||||||
| Newborns | 3. 33 ± 0.44 33 ± 0.44 | 49.50 ± 1.63 | 3.53 ± 0.45 | 50.43 ± 1.89 | 1 month | 4.15 ± 0.54 | 53.51 ± 2.13 | 4.32 ± 0.64 | 54.53 ± 2.32 |
| 2 months | 5.01 ± 0.56 | 56.95 ± 2.18 | 5 .29 ± 0.76 | 57.71 ± 2.48 | ||||
| 3 months | 6.07 ± 0.58 | 60.29 ± 2.08 903 | 61.30 ± 2.41 | |||||
| 4 months | 6.55 ± 0.79 | 62.15 ± 2.49 | 6.87 ± 0.74 | 63.79 ± 2.68 | ||||
| 9000 3 months | 7.38 ± 0.96 | 63.98 ± 2.49 | 7.82 ± 0.80 | 66.92 ± 1.99 | ||||
| 6 months | 7.97 ± 0.92 | 66.60 ± 2.44 | 8.77 ± 0.78 | 67.995 ± 2.24 80049 7 months | 8.25 ± 0.95 | 67.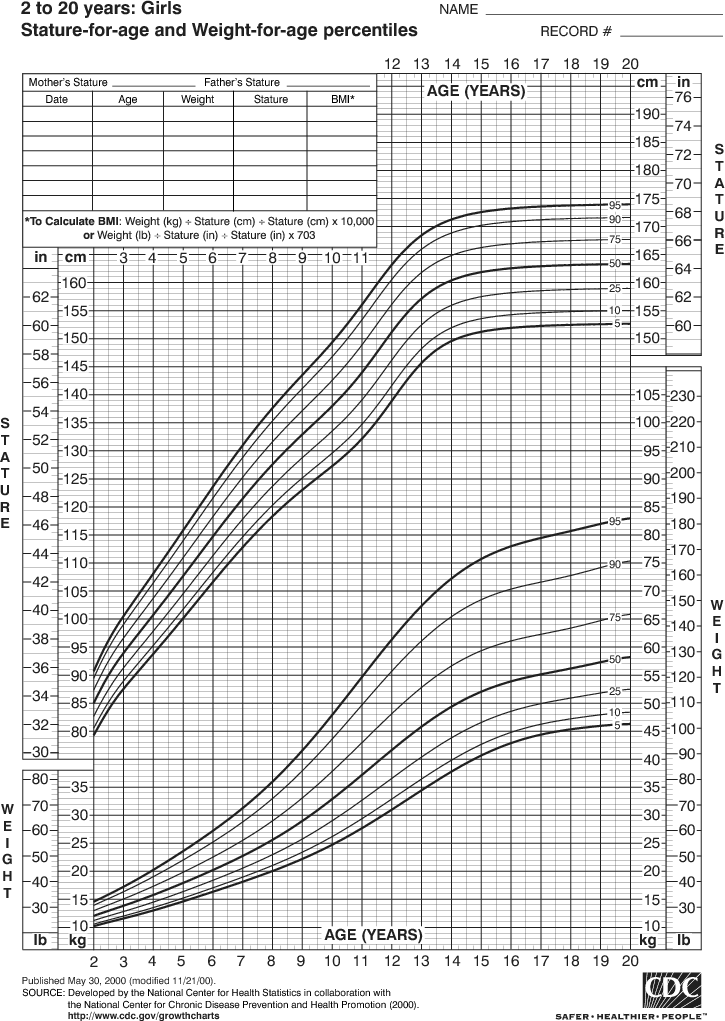 44 ± 2.64 44 ± 2.64 | 8.92 ± 1.11 | 69.56 ± 2.61 |
| 9000 3 months 9000 | 8.35 ± 1.10 | 69.84 ± 2.07 | 9.46 ± 0.98 | 71.17 ± 2.24 | ||||
| 9000 9 months | 9.28 ± 1 .01 | 70.69 ± 2.21 | 9.89 ± 1.18 | 72.84 ± 2.71 | ||||
| 10 months | 9.52 ± 1.3572.11 ± 2.86 | 10.35 ± 1.12 | 73.91 ± 2.65 | |||||
| 11 months | 9.80 ± 0, 0, 80 | 73.60 ± 2.73 | 10.47 ± 0.98 | 74.90 ± 2.55 | ||||
| 10.04 ± 1.16 | 74.78 ± 2.54 | 10.66 ± 1.21 | 75.78 ± 2.79 | |||||
Table of weight and height of the child by years (from 1 to 18 years)
weight of the child by years aged 1 to 18 years for boys and girls.
| Age | Girls | Boys | |||||
| , kg | 9000 9000, KG, KG | 9000 9000, KG, KG 9000 9000, KG, KG||||||
| 1 year 3 months | 10.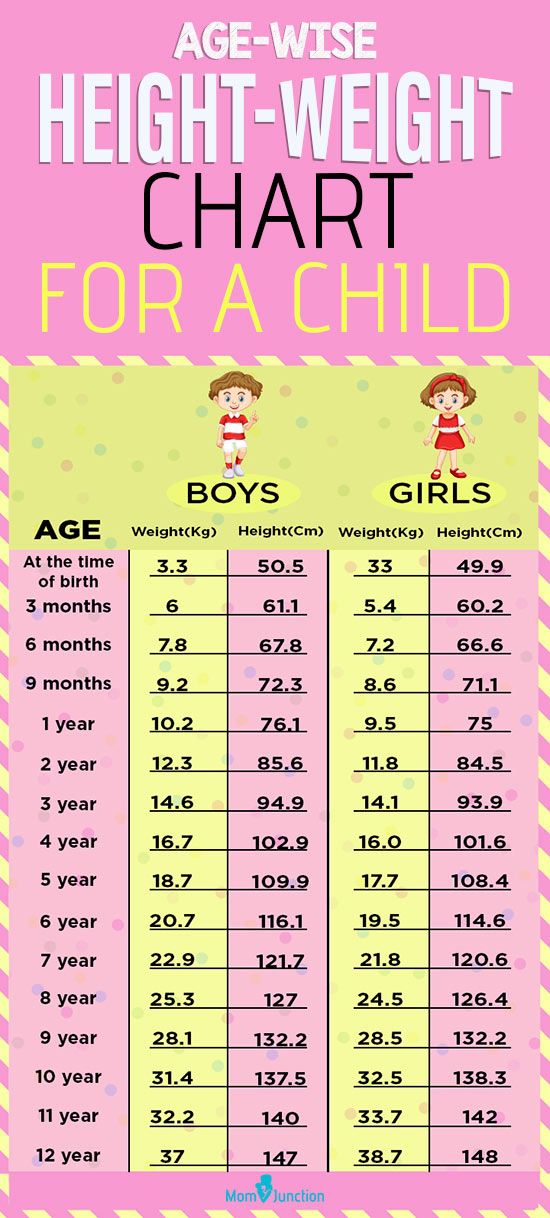 52 ± 1.27 52 ± 1.27 | 76.97 ± 3.00 | 11.40 ± 1.30 | 79.45 ± 3.56 | |||
| 1 year 6 months | 11.40 ± 1.12 | 80.80 ± 2.98 | 11.80 ± 1.18 | 81.73 ± 3.34 | |||
| 9000. 1 year | 12.27 ± 1.37 | 83.75 ± 3.57 | 12.67 ± 1.41 | 84.51 ± 2.85 | |||
| 12.6.63 ± 1.76 | 86.13 ± 3.87 | 13.04 ± 1.23 | 88.27 ± 3.70 | ||||
| 2 years 6 months | 13.93 ± 1.60 | 91.20 ± 4,28 | 13.96 ± 1.27 | 81.85 ± 3.78 | |||
| 3 years old | 14.85 ± 1.53 | 97.27 ± 3 , 78 | 14.95 ± 1.68 | 95.72 ± 3.68 | |||
| 4 years | 16.02 ± 2.30 | 100.56 ± 5.76 | 17, 14 ± 2.18 | 102.44 ± 4.74 | |||
| 5 years | 18. 48 ± 2.44 48 ± 2.44 | 109.00 ± 4.72 038 | 110.40 ± 5.14 | | ||||
| 6 years | 21.34 ± 3.14 | 115.70 ± 4.32 | 21.20 | 115.98 ± 5.51 | |||
| 7 years old | 24.66 ± 4.08 | 123.60 ± 5.50 | 24.92 ± 4.44 | 123.88 ± 5.40 | |||
| 8 years | 27.48 ± 4.92 | 129.00 ± 5.48 | 27.86 ± 4.72 | 129.94 ± 5.70 | 0049 9 years old31.02 ± 5,92 | 136.96 ± 6.10 | 30.60 ± 5.86 | 9004.64 ± 6.12
| 10 years 10 years old | 888888888834.32 ± 6.40 | 140.30 ± 6.30 | 33.76 ± 5.26 | 140.33 ± 5.60 | |||
| years 11 years | 37.40 ± 7 06 | 144.58 ± 7.08 | 35.44 ± 6.64 | 143.38 ± 5.72 | |||
| 12 years 9004 038 | 152.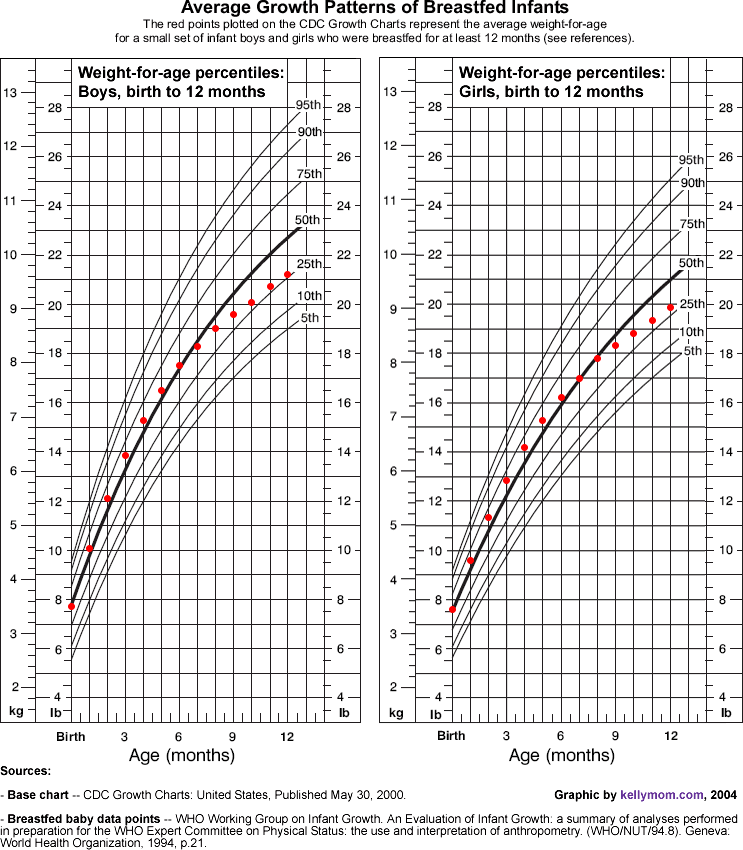 81 ± 7.01 81 ± 7.01 | 41.25 ± 7.40 | 150.05 ± 6.40 | ||||
| 48.70 ± 9.16 | 156.85 ± 6.20 | 45.85 ± 8.26 | 156.65 ± 8.00 | ||||
| 14 years old | 51.32 ± 7.30 | 160.86 ± 6.36 | 51 , 18 ± 7.34 | 162.62 ± 7.34 | |||
| 15 years old | 56.65 ± 9.85 | 161.80 ± 7.40 | 56.50 ± 13.50 ± 13.50 | 168.10 ± 9.50 | |||
| 16 years old | 58.00 ± 9.60 | 162.70 ± 7.50 | 62.40 ± 14.10 | 172.60 ± 9.40 | |||
| 17 years old | 58.60 ± 9.40 | 163.10 ± 7.30 | 67.35 ± 12.75 | 176.30 | |||
Deviations of weight or height from tabular values
There is no need to panic if there is a minimal discrepancy with the indicated values in the table, and here's why:
- First of all, the child's height and weight charts contain reference indicators , what should ideally be the weight and height of the child, without taking into account many other factors .
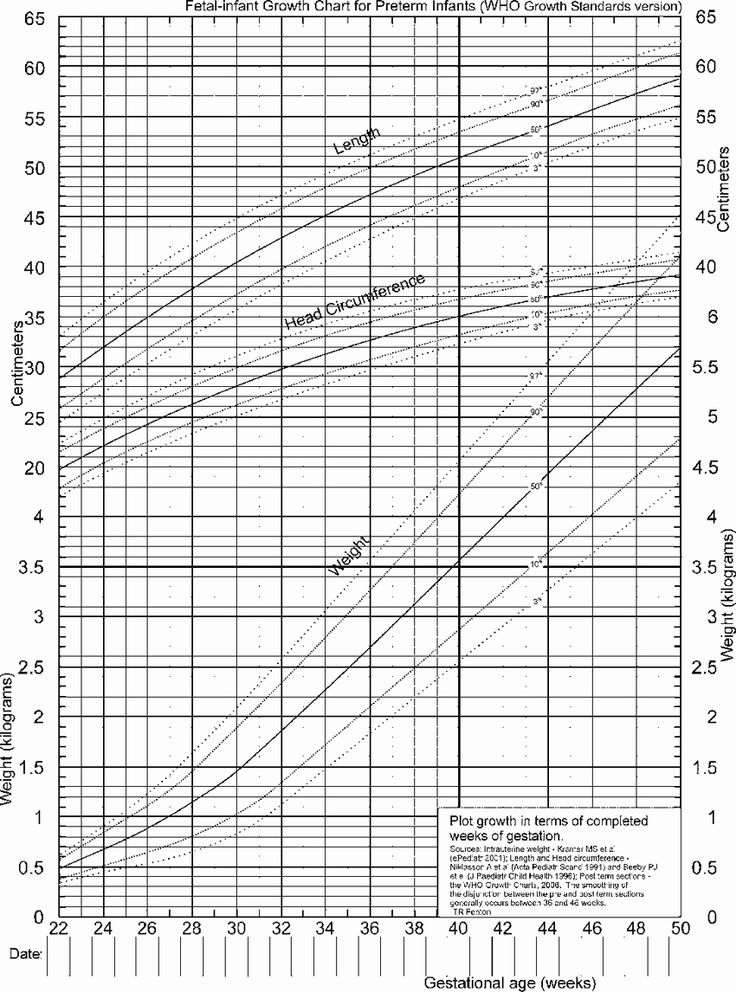 Sometimes parents of premature babies mistakenly use a standard table for comparison, while there are special tables for assessing the development of children born prematurely.
 - The rate of growth and weight gain for each child is unique . In the first year of life, babies develop in leaps and bounds. For example, during the period of introducing complementary foods, the weight of the baby may not reach the “norm” due to adaptation to a new type of food, and not because of pathology.
This does not mean that deviations from the norm should be ignored , but it is better to regard them as an occasion to pay attention and consult a specialist in order to identify possible health problems, or to make sure that they are not present.
What can cause obvious deviations from the norm?
Earlier we talked about minor deviations from the norm and that there is no need to be scared if your child is not growing and gaining weight strictly according to the chart.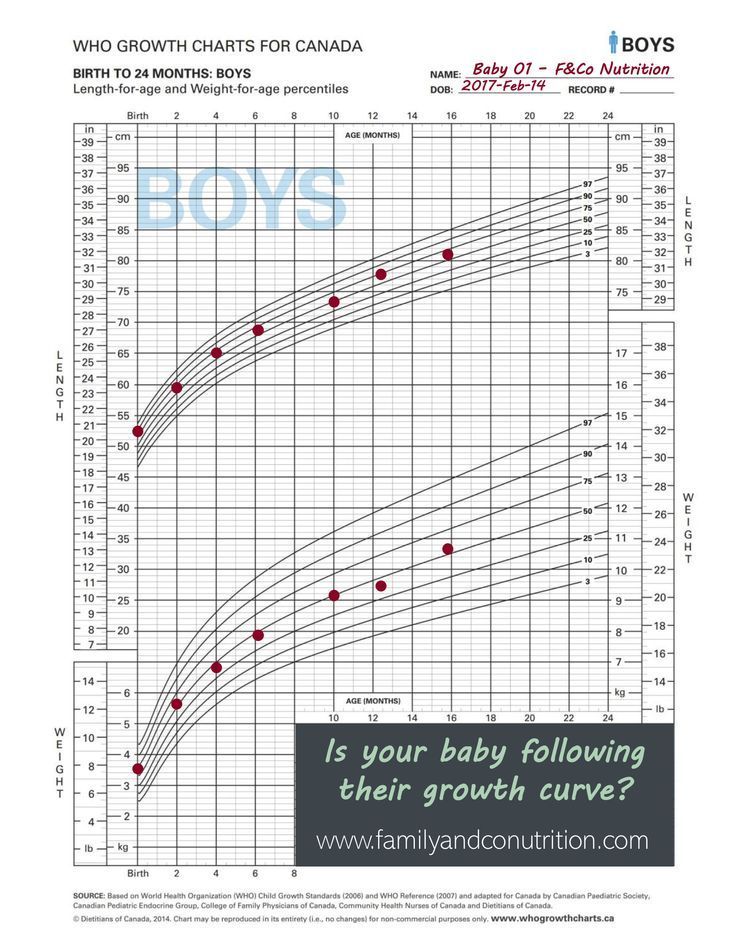 But what to do if the values of the essential have gone beyond the limits of the permissible parameters , or are they at the intersection of norm and pathology?
Reasons for possible deviations can be divided into two groups:
1. Non-endocrine:
- Constitutional growth retardation . Or in another way, the syndrome of late puberty. One of the variants of the norm, when the puberty jump occurs later than in other children.
- Family stunting . It has a hereditary predisposition, in the family of such children there are relatives with short stature. Growth retardation manifests itself from early childhood.
- Prematurity, intrauterine and postnatal injuries.
- Genetic syndromes . As a rule, they have many clinical manifestations, one of which is growth retardation.
- Chronic diseases of the cardiovascular, bronchopulmonary systems, gastrointestinal tract, as well as anemia.

- Fasting .
- Taking certain medications .
2. Endocrine:
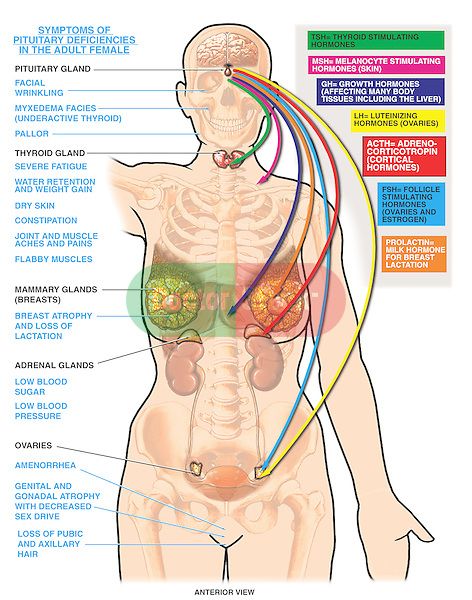
- Growth hormone deficiency . Biologically active substance, which is the main regulator of the growth process after 2 years.
- Deficiency of thyroid hormones . More often of a congenital nature, it is clinically characterized by a delay in physical and intellectual development from birth.
- Type 1 diabetes mellitus . A disease in which, due to insulin deficiency, the flow of glucose into the cells of the body is impaired, the so-called. "starvation" of cells, as a result, growth rates slow down.
- Itsenko-Cushing's disease (or syndrome) . At the same time, the production of hormones of the adrenal cortex, glucocorticoids, is increased, which in large doses leads to a violation of the secretion of growth hormone.
- Rickets .
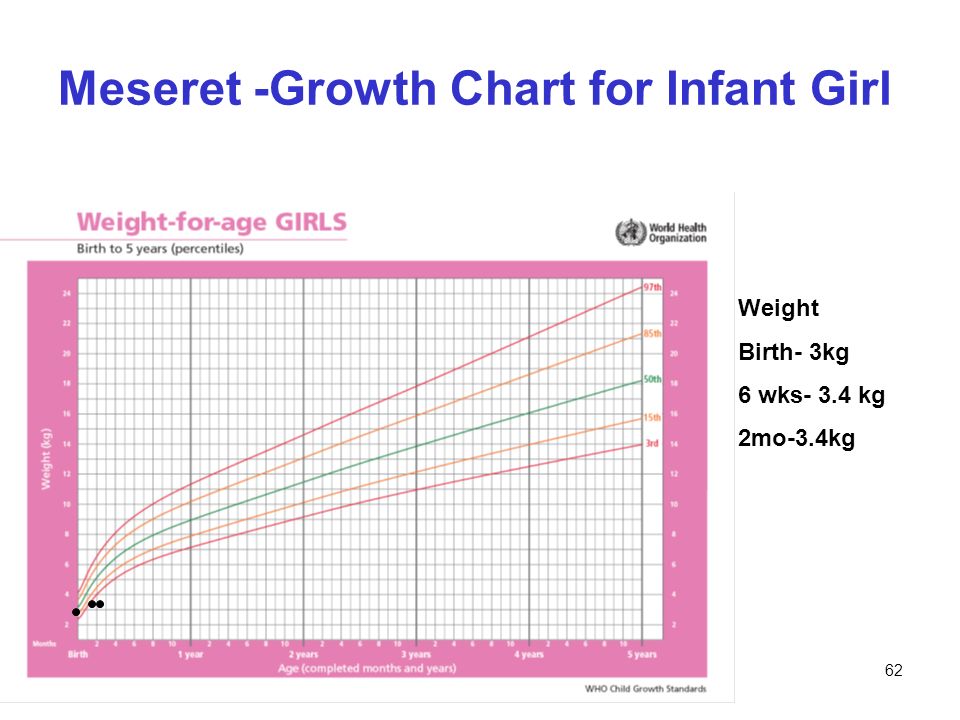 A lack of vitamin D leads to bone destruction and skeletal deformities, which in turn is manifested, among other things, by a decrease in growth.
 - Other rare disorders of the endocrine system.
As you can see, there are a lot of reasons.
If the child's growth is stunted, parents should consult a doctor to identify the causes of short stature and correct it in a timely manner.
Which specialist should I contact? First, you should make an appointment with a pediatrician. Also, in most cases, consultation with a pediatric endocrinologist is required.
Remember that for the normal growth of the child you need a complete, balanced diet with enough vitamins and minerals, as well as dosed physical activity.
Child growth charts | Bebbo
Submitted by useradmin on Thu, 08/12/2021 - 21:24
About child growth
Children's height is an indicator of their general health and nutrition.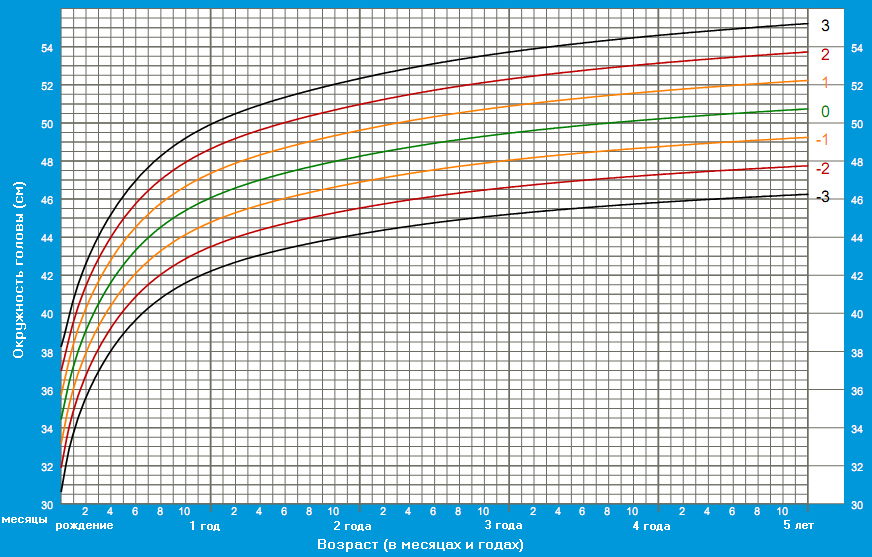
All babies and children grow at a different pace, and "normal" is not an exact value, but rather a wide range. Your child is unique and grows at the pace and schedule that suits them.
Spending time with baby, you will see him growing better than anyone else. You will notice that his clothes, cradles, baby bath, or other things that seemed huge when he was just born are getting small.
What are growth charts?
Growth charts are used by healthcare professionals and parents to track the growth and development of a child in the first years of life. The child's growth dynamics is calculated based on the World Health Organization growth standards. These standards best describe the physiological development of children from birth to five years of age and are based on observational data from 8500 children from all over the world, including Europe. The Z score, or standard deviation score, is a measure of children's height.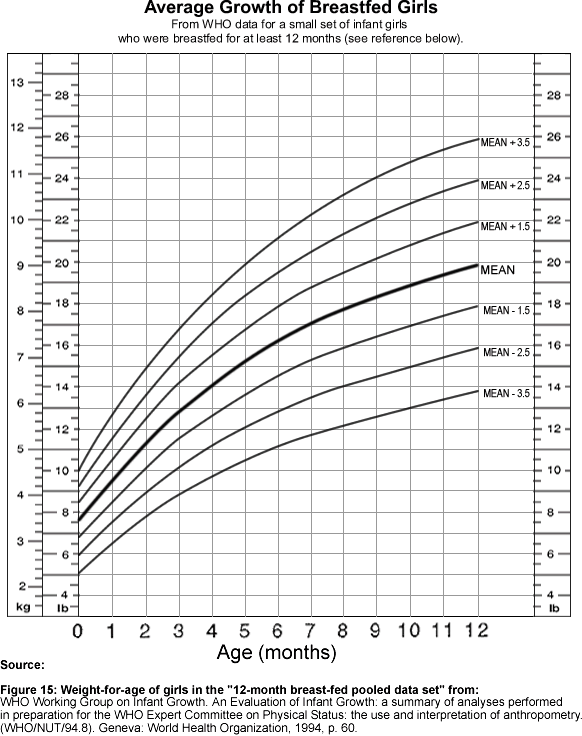 It indicates where your child's height is relative to the average.
Growth charts are charts that show your child's length or height, weight and head circumference at a given age. Your pediatrician or nurse regularly measures your child and plots the measurements on a chart. It is best to enter the results of these measurements into the mobile phone application so that your child's growth charts are always at hand and available to you.
Different growth charts are used for boys and girls, toddlers and older children.
How to "read" a child's growth chart
Growth charts have many lines (curves) that show the range of typical child growth patterns at different ages.
The height and weight of most children will fall somewhere between the upper and lower curves on the graph. One half of children grow faster than the median value of this range, and the other half slower. Limits are arbitrary, and there are two standard deviation (SD) values, above and below the mean for age.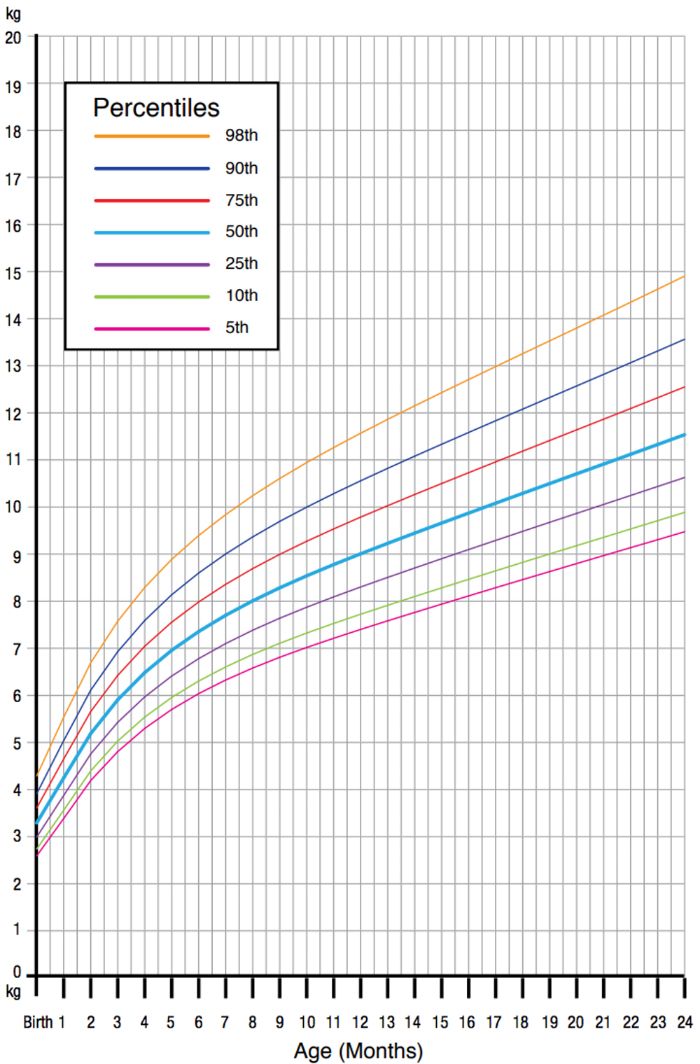
Sometimes your child's growth chart may be out of line on the chart. If this happens, your doctor will pay special attention to your child's growth parameters during the next few appointments. Your baby's growth may return to normal on its own, or your doctor may suggest what you can do to help.
- If the child's weight-for-age or weight-for-length/height is below -2 SD, the child is considered moderately malnourished or underweight, and if it is below -3 SD, severe malnutrition degree.
- If the child's weight-for-age or weight-for-length/height is between +2 SD and +3 SD, the child is considered overweight, and if above +3 SD, obese .
- If the child's length/height for age is below -2 SD, the child is considered to be stunted. Stunting is the result of chronic or recurrent malnutrition, usually due to poor diet/feeding, nutritional deficiencies, frequent illnesses, or recurring illnesses over several years.
How a child's height is measured
Before the age of two years, the length of the child is measured in the supine position.